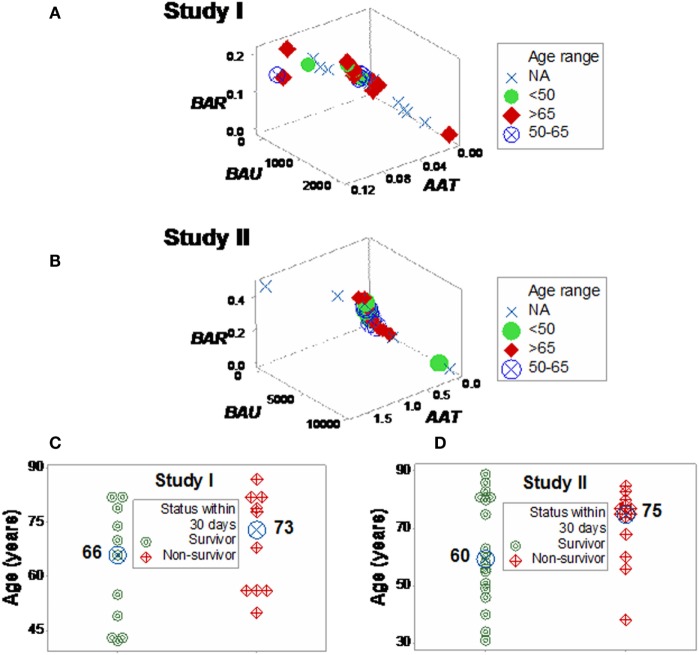
Figure 5.
Three-dimensional analysis of age data. The age of SIRS+, infected individuals did not explain the mortality rates described in Figure 4. Both study I (A) and II (B) included >65-year-old individuals in the left (low-mortality) subset and <50-year-old individuals in the right (high-mortality) subset. While the median age [large, blue circles (C,D)] was 7–15 years higher in the right subset, any age-based cutoff would result in a large number of errors because the age intervals of survivors and non-survivors overlapped (C,D).

