
Figure 9.
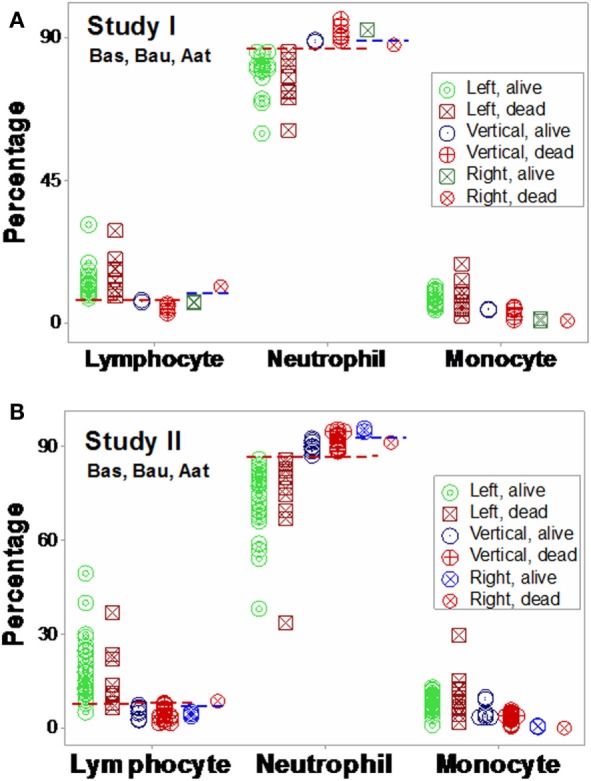
Validation of subsets detected by structure II. The immune profiles of subsets detected in Figures 7A,B were investigated. Both study I (A) and study I (B) showed non-randomly distributed leukocyte profiles, both within- and between-subsets. For instance, in both populations, within-subset differences were observed in the “right” subset, where the lymphocyte and neutrophil percentages did not overlap between survivors and non-survivors [blue horizontal lines (A,B)]. Between-subset differences were also observed, e.g., “left” subset survivors displayed higher L%, higher M%, and lower N% than survivors classified within the remaining subsets [red horizontal lines (A,B)]. Horizontal lines show some data subsets that did not overlap.