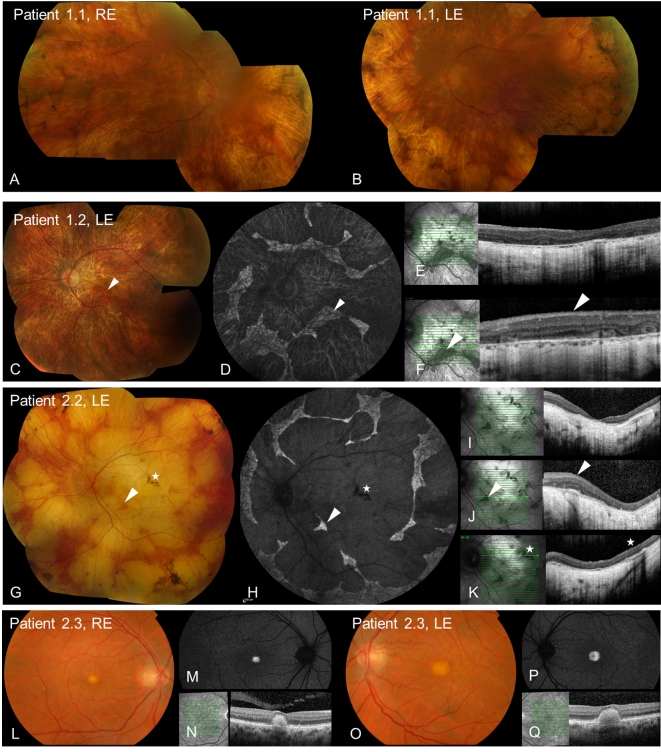
Figure 1.
Retinal imaging in dominant RPE65 disease. A, B, C, G, L, O: Color fundus photographs demonstrate extensive chorioretinal atrophy in patients 1.1, 1.2, and 2.2, with foveal yellow lesions in patient 2.3. D, H, M, P: Fundus autofluorescence (FAF) imaging demonstrates extensive loss of autofluorescence in patients 1.2 and 2.2 with scalloped regions of preserved retina and RPE, and increased autofluorescence of foveal deposits in patient 2.3. E, I, N, Q: Optical coherence tomography (OCT) through the fovea demonstrates the loss of outer nuclear and photoreceptor layers for patients 1.2 and 2.2, and dome-shaped deposits extending from the RPE to the outer retina for patient 2.3. F, J: OCT through the preserved retina and RPE in patients 1.2 and 2.2 with frequent outer retinal tubulation. K: OCT through the RPE hypertrophy in patient 2.2. Arrowheads highlight the comparative regions of the preserved retina and RPE. Stars highlight the comparative area of RPE hypertrophy.

