Figure 5.

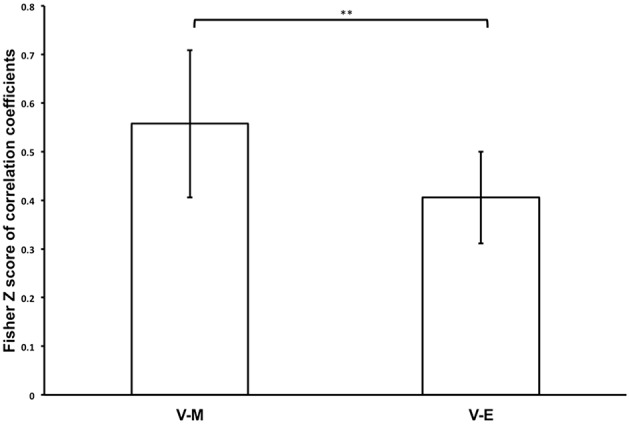
Bar graph showing mean Fisher Z-transforms of V-M and V-E correlations for the whole participant sample (**p < 0.01). Error bars denote 95% confidence intervals.

Bar graph showing mean Fisher Z-transforms of V-M and V-E correlations for the whole participant sample (**p < 0.01). Error bars denote 95% confidence intervals.