Figure 2.

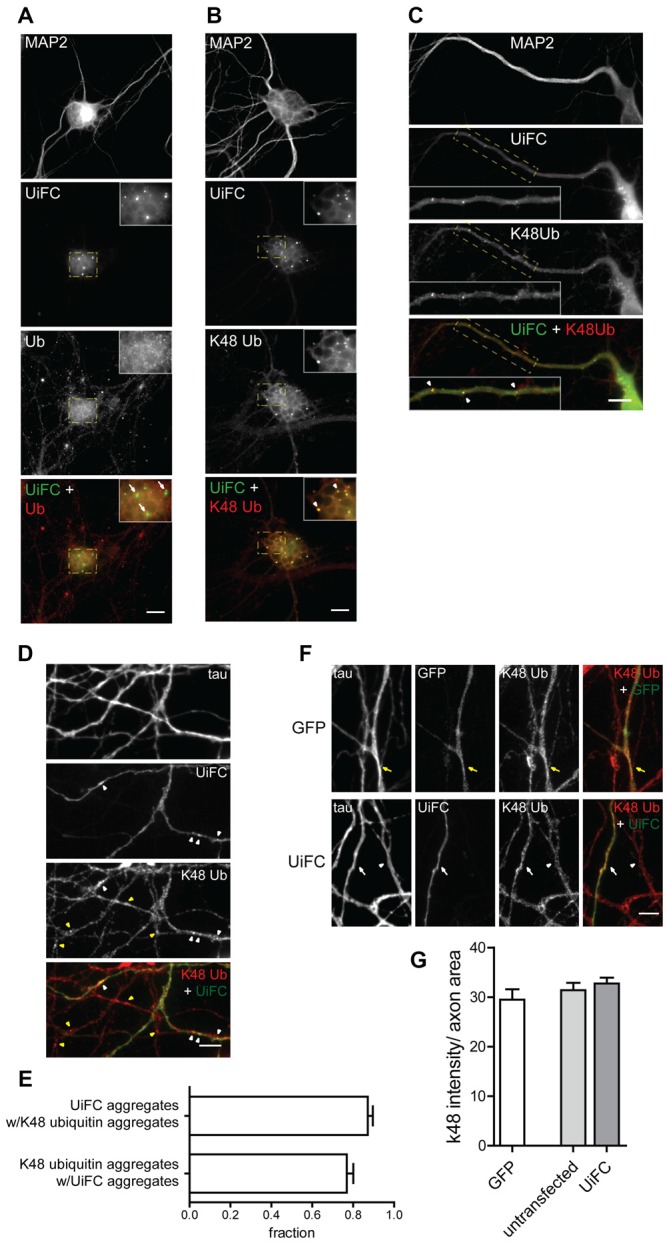
Colocalization of UiFC with K48 ubiquitin chains in neurons. (A–D) Pattern of UiFC expression and distribution in hippocampal neurons. Expression of UiFC in neurons was followed by immunostaining for (A) ubiquitin (red) or (B–D) K48-linkage specific ubiquitin (red). MAP2 and tau were used as dendritic and axonal marker respectively. UiFC has a diffuse pattern in neurons with distinct UiFC aggregates (white arrowheads) on (A,B) somas, (C) dendrites and (D) axons, which perfectly colocalize with (B–D) K48 ubiquitin staining, (A) but not ubiquitin. (A–C) Enlarged image on inset corresponds to dashed boxes. Scale bars are 10 μm. (D) Yellow arrowheads correspond to K48 ubiquitin aggregates in untransfected axons. (E) Fraction of UiFC aggregates colocalizing with K48 ubiquitin aggregates and vice-versa. (F) Assessment of UiFC effect on the levels of K48 ubiquitination along axons. Expression of GFP or UiFC was followed by staining for tau and K48 polyubiquitin (red). K48 ubiquitin staining does not vary between axons expressing GFP (yellow arrow), UiFC (white arrow) and untransfected neighbors (arrowhead). (D,F) Scale bars are 5 μm. (G) Intensity of K48 ubiquitin per axon area. Statistical significance by Kruskal-Wallis test followed by the Dunn’s multiple comparison test. A total of 39 (GFP), 90 (untransfected) and 55 (UiFC) axonal segments analyzed from three independent experiments.
