Figure 4.

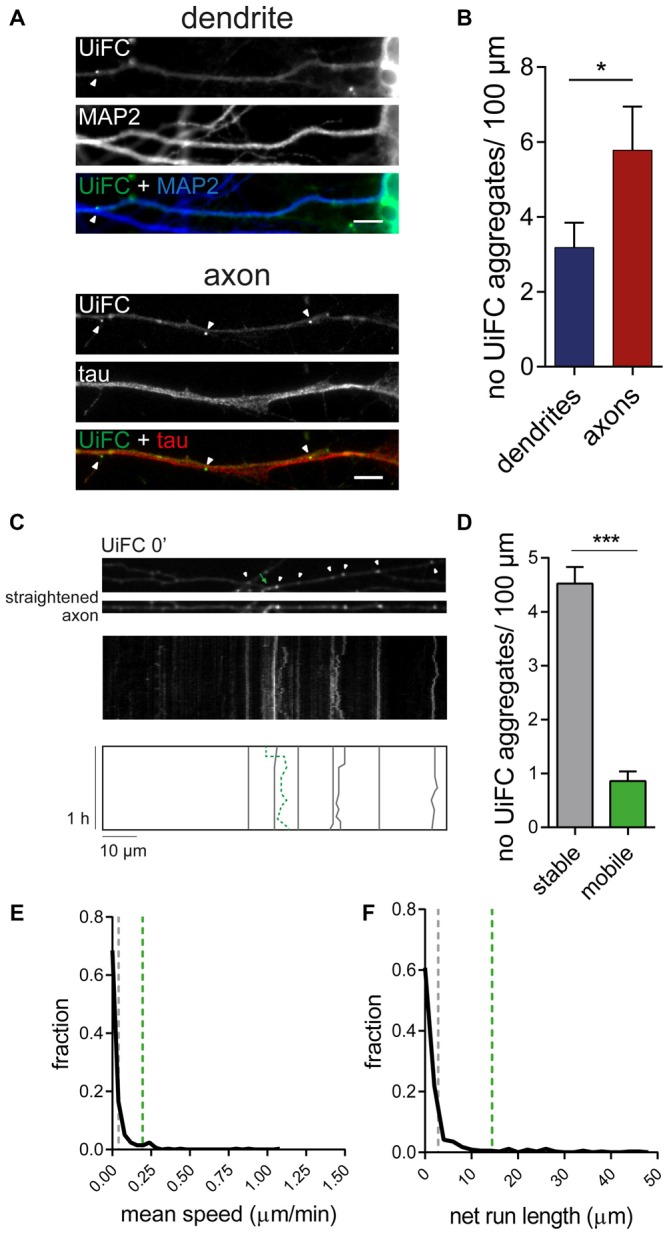
Dynamics of UiFC aggregates along axons. (A) Distribution of UiFC aggregates in dendrites and axons. Immunostaining for MAP2 (blue) and tau (red) was performed to identify dendrites (top) and axons (bottom) of neurons expressing UiFC (green). Arrowheads indicate UiFC aggregates. Scale bars represent 5 μm. (B) Quantification of number of UiFC aggregates per 100 μm of dendritic and axonal segment shows a higher density of UiFC aggregates in axons than in dendrites. Results are represented as Mean ± SEM. Statistical significance assessed by Mann Whitney test (*p < 0.05). A total of 35 dendritic and 25 axonal segments were analyzed from three independent experiments. (C) Mobility of UiFC aggregates along axons. Time-lapse imaging, every 1 min for 1 h, was performed in UiFC-expressing axons to evaluate aggregates’ mobility. Top, Representative segment of a UiFC-expressing axon at the beginning of the time lapse. Arrowheads and arrow correspond to stable and mobile UiFC aggregates, respectively. Middle, representative kymograph obtained from a continuous movie at 1 min/frame (1 h total time) showing trajectories of UiFC aggregates. Bottom, schematic representation of UiFC trajectories. Gray lines and dashed green line represent tracks of UiFC aggregates at arrowheads and arrow, respectively. UiFC aggregates along axons are mostly stable. (D) Quantification of the number of mobile [mean instant speed greater than 0.05 μm/min and net run length greater than twice aggregates’ width (0.08 μm)] and stationary UiFC aggregates per 100 μm of axon length. Results are shown as Mean ± SEM. Statistical significance assessed by Wilcoxon paired t-test (***p < 0.001). A total of 93 axonal segments were analyzed from three independent experiments. (E,F) Fraction distribution of individual UiFC aggregates’ (E) mean instant speed (μm/min) and (F) net run length (μm). Dashed gray and green lines indicate averaged mean for stable and mobile UiFC aggregates, respectively. Data from 334 individual UiFC aggregates (285 stable and 49 mobile) from three independent experiments.
