Figure 6.
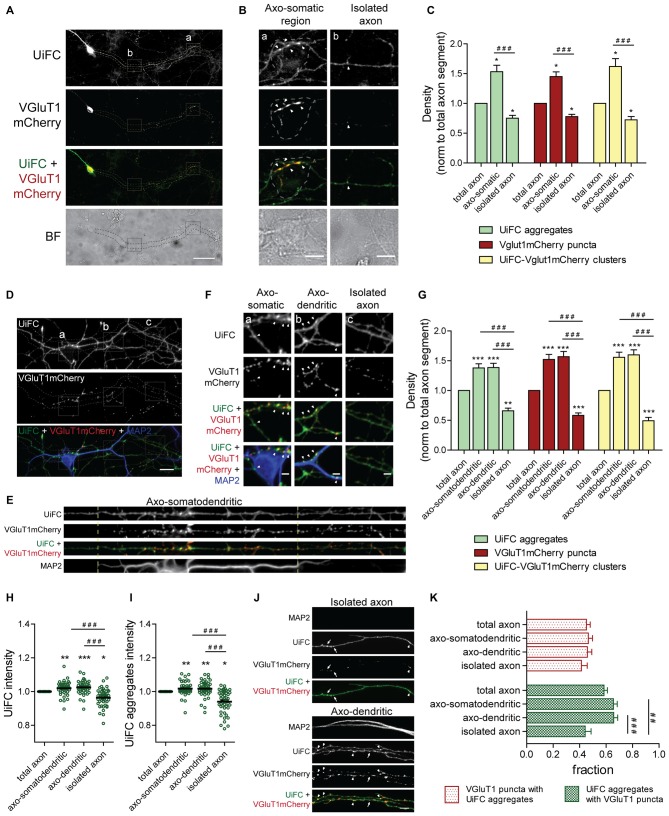
Distribution of UiFC aggregates along axons is biased towards axonal regions contacting somas and dendrites and presynaptic sites. (A) Differential distribution of axonal UiFC aggregates and presynaptic clusters between somatic and non-somatic axonal domains. Dual expression of UiFC (green) and the presynaptic reporter VGluT1mCherry (red) was performed in hippocampal neurons. Along axons, UiFC aggregates and VGluT1mCherry puncta were preferentially located at soma contacting axonal regions. Dashed area encircles axon of interest expressing UiFC and VGluT1mCherry. Scale bar represents 50 μm. (B) Enlarged images of boxes in (A) showing axonal segments contacting somas (a, axo-somatic) and without contact (b, isolated axon). Dashed lines outline somatic regions detected in the brightfield. Higher density of both UiFC aggregates and VGluT1mCherry puncta were observed at somas. Arrowheads indicate UiFC-VGluT1mCherry clusters. Scale bars represent 10 μm. (C) Averaged density of UiFC aggregates (green), VGluT1mCherry puncta (red) and UiFC-VGluT1mCherry clusters (yellow) per axonal length at segments contacting somas and isolated ones. Results are normalized to density along the total length of each axon. UiFC-VGluT1mCherry clusters correspond to colocalization events between UiFC aggregates and VGluT1mCherry puncta. Twenty axonal segments (length between 50 and 300 μm) were analyzed from three independent experiments. (D) Distribution of axonal UiFC aggregates and presynaptic clusters at somatodendritic structures and isolated axons. Following dual expression of UiFC (green) and VGluT1mCherry (red), staining for MAP2 (blue), GFP and mCherry was performed. Higher density of axonal UiFC aggregates and VGluT1mCherry puncta at MAP2+ structures. Dashed area encircles axon of interest. Scale bar represents 20 μm. (E) Straightened images of dashed area in (D). Dashed lines highlight sites of somatodendritic contact. (F) Enlarged images of boxes in (D) showing axonal segments contacting somas (a), dendrites (b) and isolated axons (c). Arrowheads indicate UiFC-VGluT1mCherry clusters. Scale bars represent 5 μm. (G) Averaged density of UiFC aggregates (green), VGluT1mCherry puncta (red) and UiFC-VGluT1mCherry clusters (yellow) per axonal length at axonal segments contacting somatodendritic and dendritic elements and isolated ones. Results are normalized to density along the total length of each axon. (H,I) Intensity of (H) UiFC and (I) UiFC aggregates along the axon at sites with and without contact with MAP2+ structures. For each axonal segment, results were normalized to intensity values in the total axon. (J) UiFC aggregates co-localize with presynaptic clusters. Colocalization between UiFC (green) and VGluT1mCherry (red) signal along axons showed that the majority of UiFC aggregates overlap with presynaptic puncta. Arrowheads and arrows point to clusters of UiFC-VGluT1mCherry and UiFC aggregates alone, respectively. Scale bar represents 5 μm. (K) Fraction of axonal UiFC aggregates colocalizing with VGluT1mCherry puncta (green bars) and vice-versa (red bars) at sites with and without somato and/or dendritic contact. (C,G–I,K) Results are shown as Mean ± SEM. Statistical significance by Kruskal-Wallis test followed by the Dunn’s multiple comparison test (*p < 0.05, **p < 0.01 and ***p < 0.001 when compared to total axon and ##p < 0.01 and ###p < 0.001 between indicated conditions). (G–I,K) 45 axonal segments (length between 50 and 400 μm) were analyzed from three independent experiments.

