Figure 7.
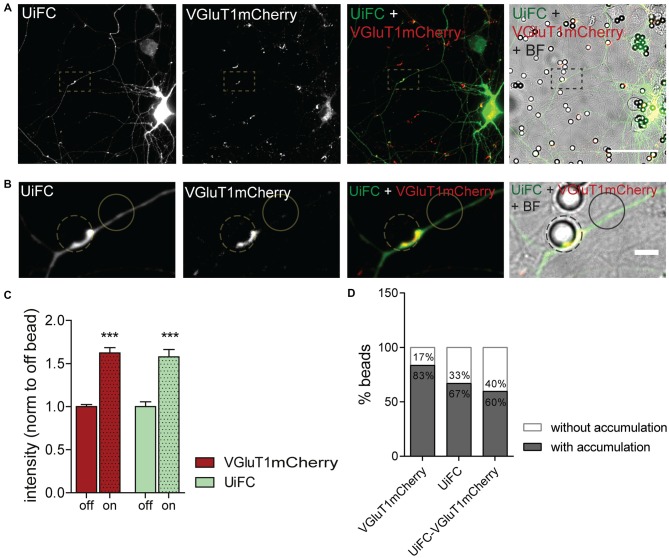
Enhanced UiFC fluorescence at newly formed presynaptic terminals. (A) UiFC signal on bead-induced presynaptic clusters. Neurons were co-transfected with UiFC (green) and VGluT1mCherry (red) and poly-D-lysine (PDL)-coated beads added for a total of 8 h. UiFC signal was greatly enhanced in bead-induced presynaptic clusters. Scale bar represents 50 μm. (B) Enlarged images of box in (A). Scale bar represents 5 μm. (C) Quantitative values of VGluT1mCherry and UiFC intensity at on- and off-bead sites (all beads included in the analysis). Results are normalized to off-bead and shown as mean ± SEM. Statistical analysis by Wilcoxon paired t-test (***p < 0.001 between on and off for each marker). (D) Percentage of beads inducing accumulation of UiFC, VGluT1mCherry and both on contacting axons in relation to adjacent off-sites. A total of 152 beads were analyzed from two independent experiments.

