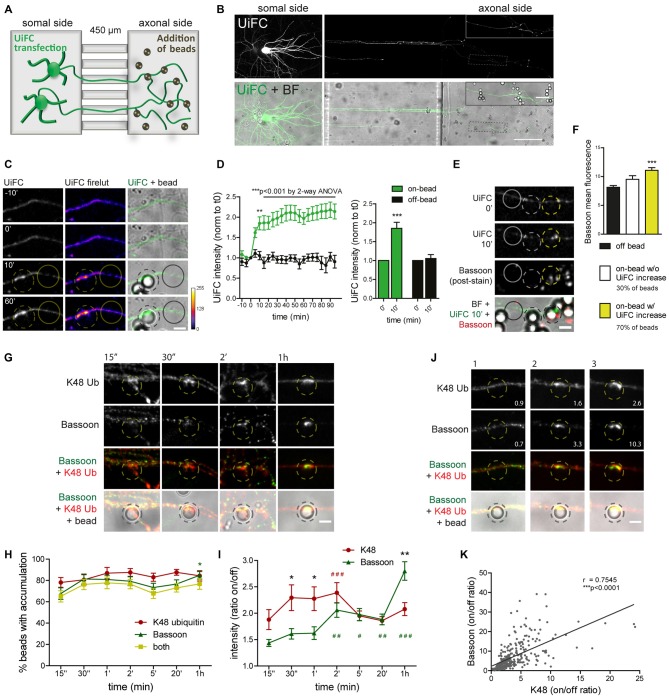
Figure 8.
Rapid increase in UiFC intensity on beads correlates with presynaptic formation. (A) Schematic representation and (B) representative image of a microfluidic platform to monitor changes in axonal polyubiquitination upon bead contact. (A,B) Expression of UiFC at the somal side of microfluidic devices resulted in UiFC+ axons reaching the axonal compartment, to which beads were subsequently added and their effect on the contacting axon monitored by live-cell imaging. Thicker branches on soma side represent dendrites that do not cross into the axonal compartment. (B) UiFC signal was differently adjusted between right and left images to prevent over-saturation in somas. Enlarged image on right upper corner corresponds to dashed box. Scale bars represent 20 μm and 100 μm. (C) Profile of axonal UiFC intensity upon bead contact at on- and off-bead sites. Individual frames of a time-lapse series showing the initial contact of a bead (dashed circle) with a UiFC-expressing axon (firelut, green). Images were taken every 5 min. Bead contact resulted in a rapid and strong increase in local UiFC intensity, as opposed to an off-bead adjacent site (solid circle). (D) Left, Quantification of UiFC intensity at beads (on-bead, green) and adjacent sites (off-bead, black) throughout time. Statistical significance was assessed by 2-way ANOVA (***p < 0.001 and **p < 0.01 between on- and off-bead at each time-point). Right, Comparison of UiFC intensity values at 0 min and 10 min post-bead contact for both on- and off-bead sites. Statistical analysis by Wilcoxon paired t-test (***p < 0.001 when compared to the correspondent 0 min time-point). Results are normalized to 0 min, which corresponds to the frame preceding addition of beads, and shown as Mean ± SEM. A total of 193 beads and equivalent off-bead sites analyzed from two independent experiments. (E) Correlation between enhanced UiFC signal on beads and posterior presynaptic clustering. Retrospective labeling for the active zone marker Bassoon (red) was performed 4–5 h post-UiFC (green) time-lapse on beads. Clustering of presynaptic material was greater on beads that displayed increased UiFC intensity shortly after bead contact (yellow vs. white dashed circle). Solid circle indicates off-bead site. (F) Averaged raw Bassoon intensity values at off- and on-bead sites. Beads were divided into two pools according to their effect on axonal UiFC intensity at 10 min contact: beads not changing UiFC signal (~30%, white bar) and beads eliciting increases in UiFC signal above off-bead levels (~70%, yellow bar). Statistical significance by Kruskal-Wallis test followed by the Dunn’s multiple comparison test (***p < 0.001 compared to off-bead). Data from 191 beads (57 and 134 beads without and with UiFC increase at 10 min bead contact) and equivalent off-bead sites from two independent experiments. (G) Time-course of K48 ubiquitin and Bassoon accumulation on beads. Axons in microfluidic devices were exposed to beads for the indicated periods of time and stained for Bassoon (green) and K48 ubiquitin (red). Both K48 ubiquitin and Bassoon rapidly build up on beads. Initial strong accumulation of K48 ubiquitin is followed by Bassoon clustering. The scale bar is 5 μm. (H) Percentage of beads with accumulation of K48 ubiquitin and Bassoon. (I) Ratio of K48 ubiquitin and Bassoon intensity between bead and corresponding adjacent site. (H,I) For individual K48 ubiquitin (red) and Bassoon (green) timelines, statistical significance by Kruskal-Wallis test followed by the Dunn’s multiple comparison test (###p < 0.001, ##p < 0.01 and #p < 0.05 compared to 15’). Comparison between K48 ubiquitin and Bassoon at each time-point by 2-way ANOVA (*p < 0.05). Data from 112 (15”), 76 (30”), 89 (1’), 134 (2’), 154 (5’), 129 (20’) and 114 (1 h) beads from 3–4 independent experiments. (J) Correlation between the amount of K48 ubiquitin and Bassoon at beads (2 h contact). Values at bottom right are the ratios of intensities at on- and off-site for each bead shown. The scale bar is 5 μm. (K) Positive correlation between K48 ubiquitin and Bassoon at beads (r, Spearman’s rank correlation coefficient; ***p < 0.001). A total of 297 beads analyzed from two independent experiments.

