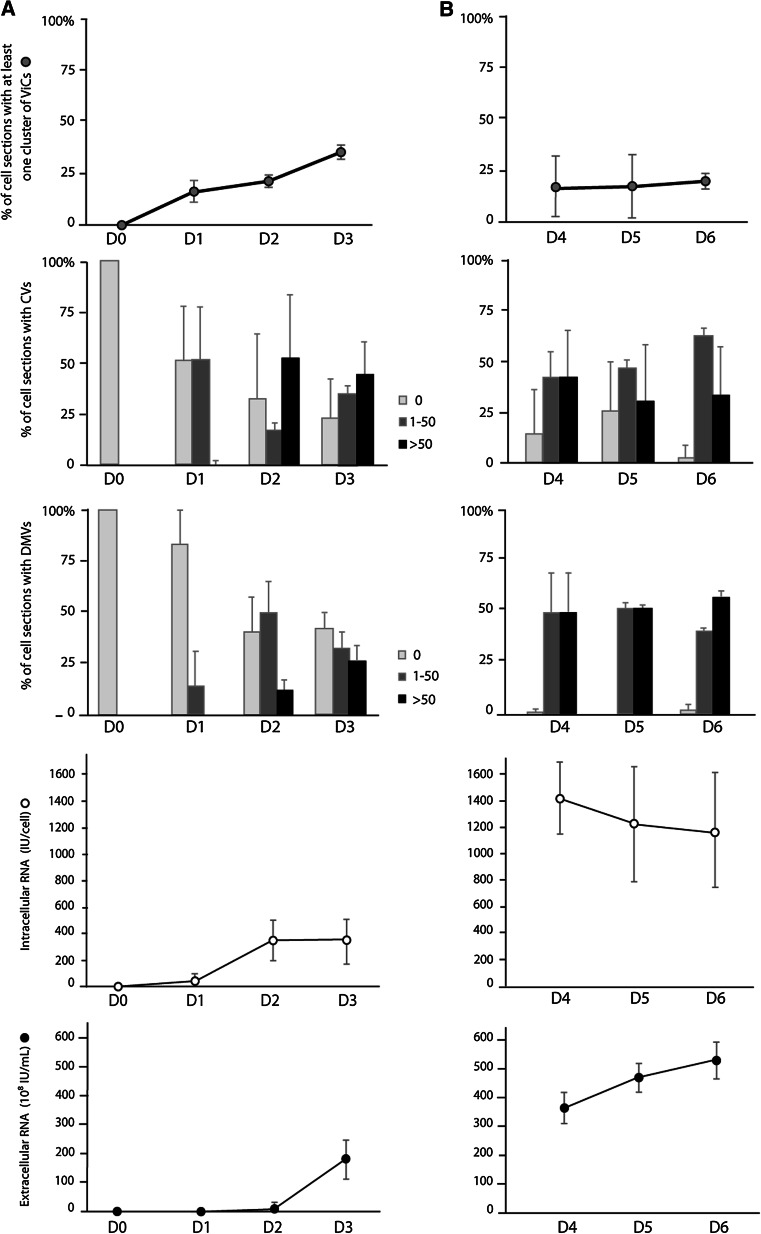
Fig. 2.
Quantitative analysis of the various types of vesicle observed in Huh7.5 cells in the 6 days following HCVcc infection, and quantification of intracellular/extracellular HCV RNA. a Early in the time course, cells were infected on day 0 by incubation for 16 h with an optimized JFH-1 virus strain, then washed with medium and cultured for a further 3 days. b One flask was then treated with trypsin on day 2 to initiate a subculture which was continued until day 6. Each day, a cell pellet was collected for the qualitative and quantitative analysis, by EM, of 60 consecutive cell sections. ViCs were the least abundant structures and their frequency is indicated as the percentage (gray circles) of cell sections with at least one vesicle cluster. CVs and DMVs were extremely abundant in infected cells and their frequency is indicated as the percentage of cell sections containing no (0) vesicles, 1–50 vesicles, or more than 50 vesicles (light gray, dark grey, and black bars, respectively). Intracellular (white circles) and extracellular (black circles) HCV RNA were quantified at each time point, with the Abbott m2000sp–m2000rt real-time PCR assay. In all experiments, uninfected Huh7.5 cells were used as a negative control. The data presented are the mean values and standard deviations for three independent experiments

