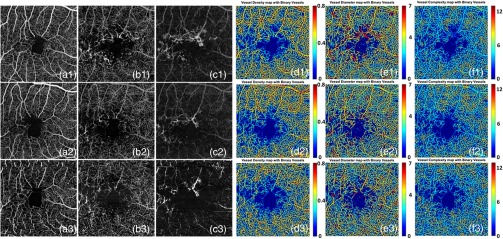
Fig. 11.
Three OCTA scans of a patient with MacTel2 monthly apart. a1–a3 shows the superficial retina for the first, second, and third scans, respectively. b1–b3 shows the deep retina for three scans, respectively. c1–c3 shows the outer retina for three scans, respectively. d1–d3 shows the vessel density map for three scans, respectively and e1–e3 shows the vessel diameter maps for three visits while f1–f3 shows the vessel complexity maps for all three visits.

