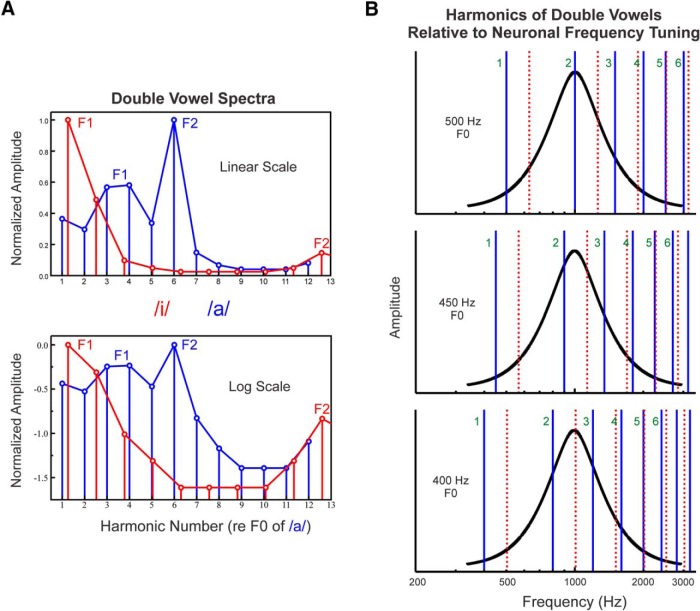
Figure 1.
Schematic representation of the double vowel stimuli presented in the study. A, Spectra of double vowel stimuli plotted on both linear and logarithmic scales. Stimulus amplitude and frequency are represented along the vertical and horizontal axes, respectively. Stimuli consisted of a series of two simultaneously presented vowels, /a/ and /i/, with a fixed F0 difference between them of four semitones (a major 3rd). Harmonics of the vowel with the lower F0 (/a/) and higher F0 (/i/) are represented by the vertical blue and red drop lines, respectively. The spectral envelopes of the vowels are represented by the lines connecting the vertical drop lines. Main formants of the vowels (peaks in the spectral envelopes) are labeled. B, Harmonics of double vowels relative to neuronal frequency tuning. Harmonics of the vowel with the lower F0 (/a/) and higher F0 (/i/) are represented by the solid blue and broken red lines, respectively. All harmonics are shown at equal amplitude for clarity. The F0 of the vowel with the lower pitch is varied such that harmonics of the double vowel fall progressively on either the peak (at the BF, here equal to 1000 Hz) or the sides of the neuronal frequency response function (black). As the F0 of the higher-pitched vowel (/i/) is fixed at four semitones above the F0 of the lower-pitched vowel (/a/), the F0 of the higher-pitched vowel varies correspondingly. The F0 of the vowel /a/ is indicated on the left of each plot; the first six harmonics of /a/ are labeled. If individual harmonics of the double vowel stimuli can be resolved by frequency-selective neurons in A1, then response amplitude as a function of F0 (or harmonic number: BF/F0) should display peaks when a given harmonic of /a/ or /i/ overlaps the BF (top and bottom plots) and troughs when the BF falls in between two adjacent harmonics of the concurrent vowels (middle plot).

