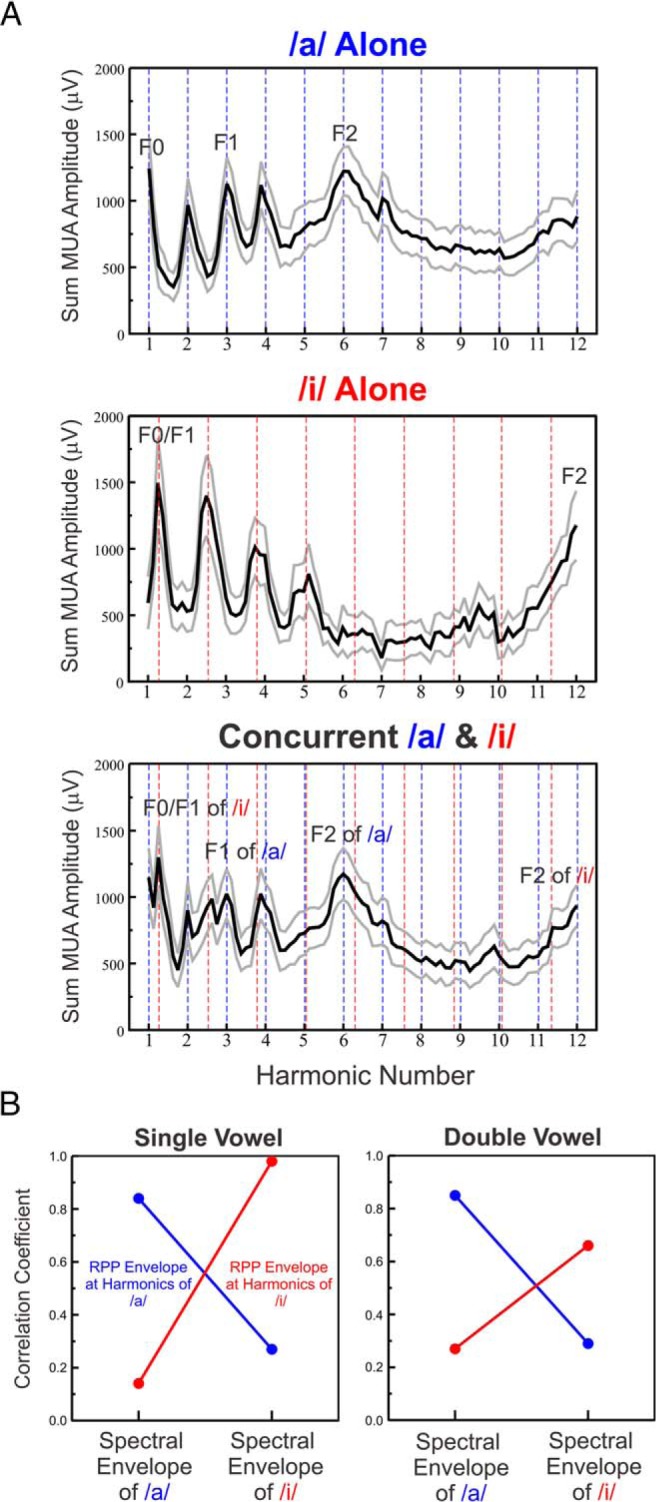
Figure 6.

A. Rate-place profiles of responses to single and double concurrent vowels averaged across all recording sites. Mean ± SEM are represented by black and gray lines, respectively. B. Pearson correlation between envelopes of average rate-place profiles at harmonics of the vowels (left: single, right: double) and the spectral envelopes of the single vowel stimuli. Same conventions as in Figure 4.
