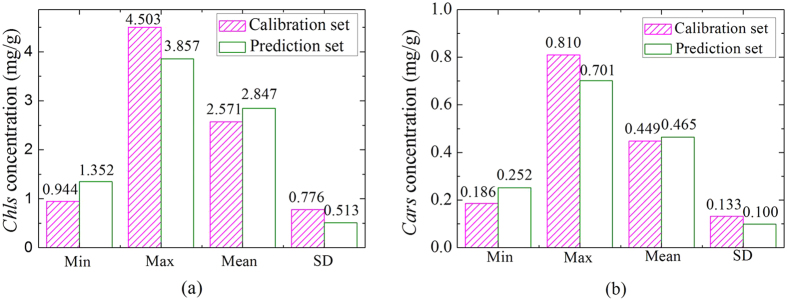
Figure 2.
The measured Chl-BA (a) and Car-BA (b) content distributions in the calibration set and prediction set. Note: Min: Minimum; Max: Maximum; SD: Standard deviation. SPXY method was used to divide all samples into calibration set with 130 samples and prediction sets with 64 samples for modelling.

