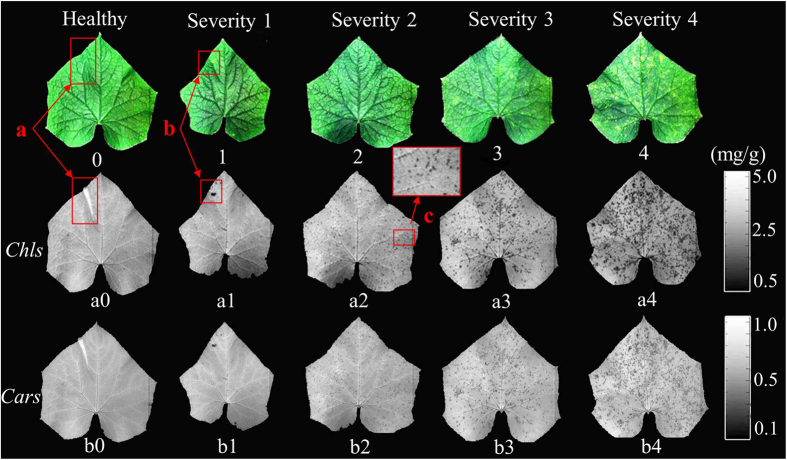
Figure 5. Chl-HSI and Car-HSI distributions in cucumber leaves with the ALS infection.
Chl-HSI and Car-HSI of leaves in hyperspectral images were calculated based on the function (2) and (3), and the spatial distribution was executed by an image processing program. 0–4: RGB (R: 662 nm; G: 554 nm; B: 450 mn) images of healthy leaves and samples with disease severity 1, 2, 3, and 4, respectively; a0–a4: Chl-HSI content distributions of the samples; b0–b4: Car-HSI content visualization maps of the cucumber leaves; a: wrinkle part; b: disease spot; c: partially enlarged details of the disease spots.

