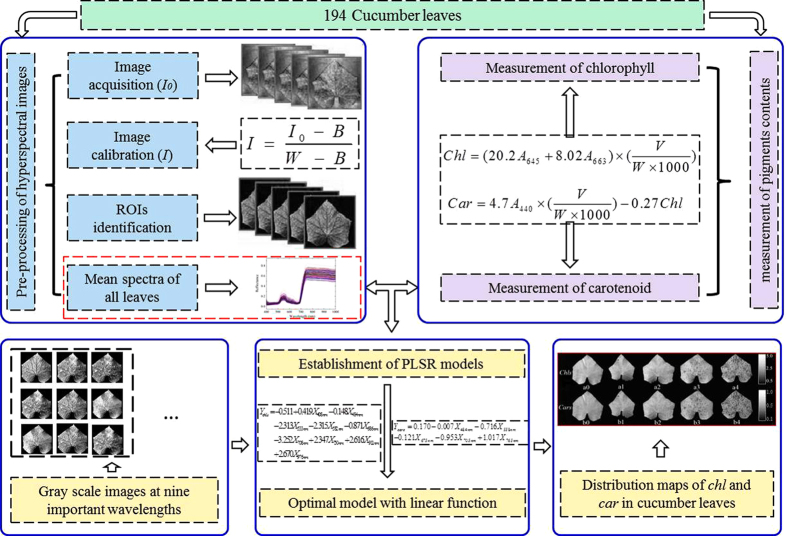
Figure 6. Main steps of determining of Chl-HSI and Car-HSI values in cucumber leaves infected with ALS by hyperspectral imaging.
There were three main steps to map the Chl-HSI and Car-HSI spatial distribution. (1) After hyperspectral images acquisition and correction, reflectance values were extracted from the regions of interest (ROIs). (2) Then Chl and Car contents were determined by biochemical analysis (Chl-BA, Car-BA). Averaged spectra of samples and contents of Chl-BA, Car-BA were used to select the important wavelengths (IWs) for developing the partial least square regression (PLSR) models. (3) The established PLSR models were used to calculate the Chl-HSI and Car-HSI values at each pixel on the hyperspectral images. Finally, Chl-HSI and Car-HSI spatial distribution in cucumber leaves infected with different severities of Pseudomonas syringae pv. lachrymans infection were displayed with the help of MATLAB software.

