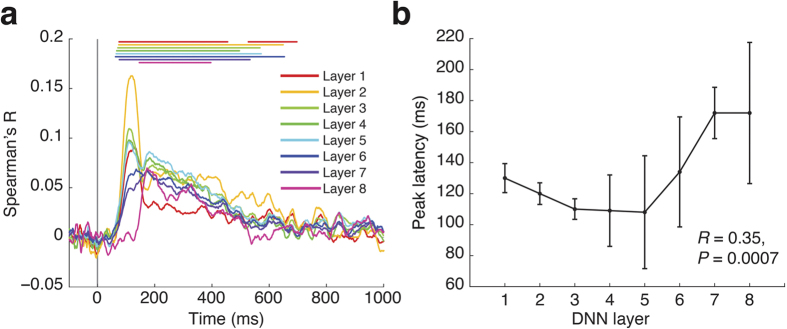
Figure 3. Representations in the object DNN correlated with emerging visual representations in the human brain in an ordered fashion.
(a) Time courses with which representational similarity in the brain and layers of the deep object network emerged. Color-coded lines above data curves indicate significant time points (n = 15, cluster definition threshold P = 0.05, cluster threshold P = 0.05 Bonferroni-corrected for 8 layers; for onset and peak latencies see Suppl. Table 2). Gray vertical line indicates image onset. (b) Overall peak latency of time courses increased with layer number (n = 15, R = 0.35, P = 0.0007, sign permutation test). Error bars indicate standard error of the mean determined by 10,000 bootstrap samples of the participant pool.

