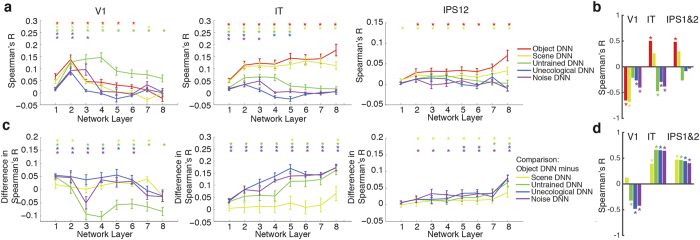
Figure 6. Architecture, task constraints, and training procedure influence the topographically ordered correlation in representations between DNNs and human brain.
(a) Comparison of fMRI representations in V1, IT and IPS1&2 with the layer-specific DNN representations of each model. Error bars indicate standard error of the mean as determined by bootstrapping (n = 15). (b) Correlations between layer number and brain-DNN representational similarities for the different models shown in (a). Non-zero correlations indicate hierarchical relationships; positive correlations indicate an increase in brain-DNN similarities towards higher layers, and vice versa for negative correlations. Bars color-coded as DNNs, stars above bars indicate significance (sign-permutation tests, P < 0.05, FDR-corrected, for details see Suppl. Table 4a). (c) Comparison of object DNN against all other models (subtraction of corresponding points shown in a). (d) Same as (b), but for the curves shown in (c) (for details see Suppl. Table 4b).

