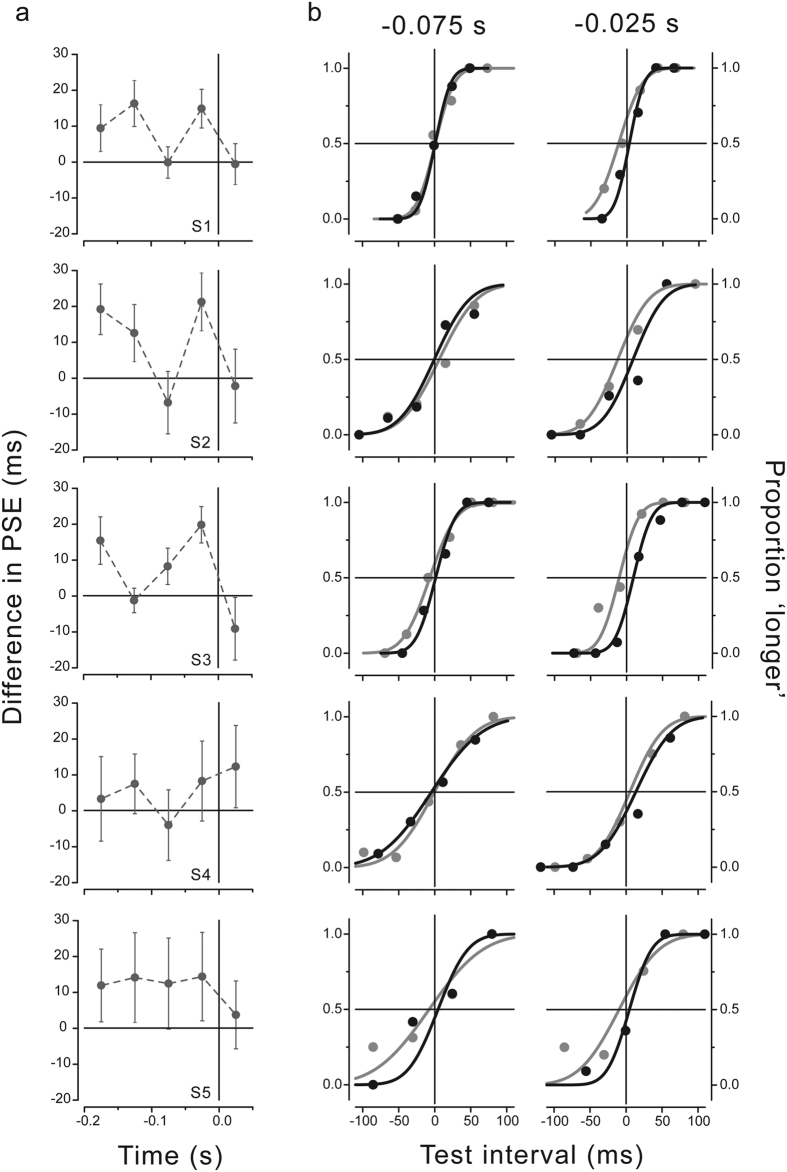
Figure 3.
(a) Difference between the PSEs for the right and left hand force direction as a function of stimulus presentation time with respect to movement onset time (zero time). Results for all subjects. Error bars represent standard errors estimated by bootstrap. (b) Psychometric functions showing the proportion of trials where the test stimulus interval was judged to be longer than the standard interval in the isometric condition. Data for all subjects are shown for two critical stimulus presentation times relative to force onset (−0.075 and −0.025 s; bin size of 50 ms) for the right (black) and left (gray) movement directions. The test stimulus interval is expressed as deviation from the mean individual PSE. The vertical and horizontal lines represent no deviation from the mean perceived time.

