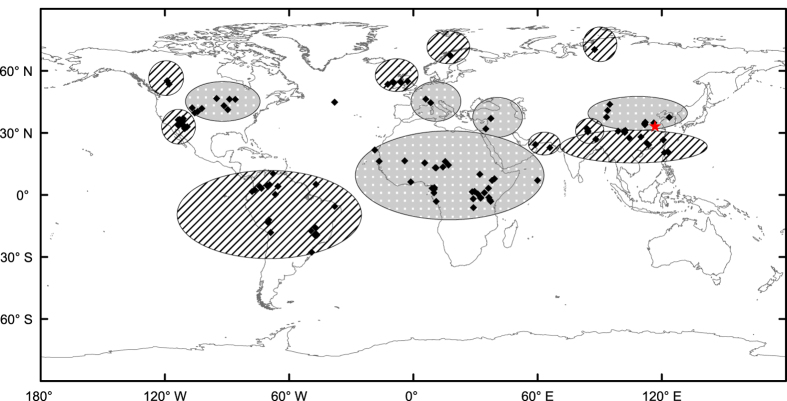
Figure 3. Global distribution of the “Bond Holocene IRD Event 3”.
The red star represents the Yuchisi site. The hatched areas were affected by drought or dust storms, and the dotted areas by wet conditions or flooding. See text for references. The map was created with ArcGIS 10.3.1 (http://www.esri.com/software/arcgis).

