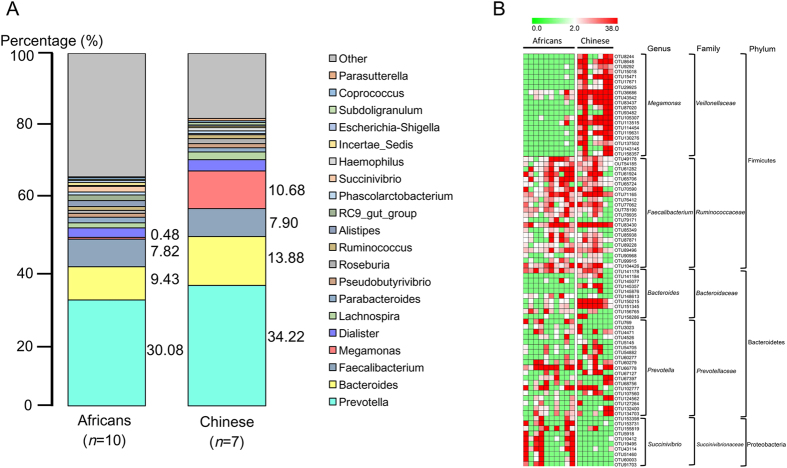
Figure 2. Intestinal microbiota communities of Chinese and Africans.
(A) The relative abundance map for the bacteria in the stool were analyzed by 16S rRNA pyrosequencing. Feces were collected from all the participants enrolled in the pharmacokinetic study. The values were represented as the average abundance of each genus in the metagenomics test (percentage). (B) Heatmap and represented bacterial taxa information (species, genus, family and phylum) of 81 significantly changed OTUs between Africans and Chinese.

