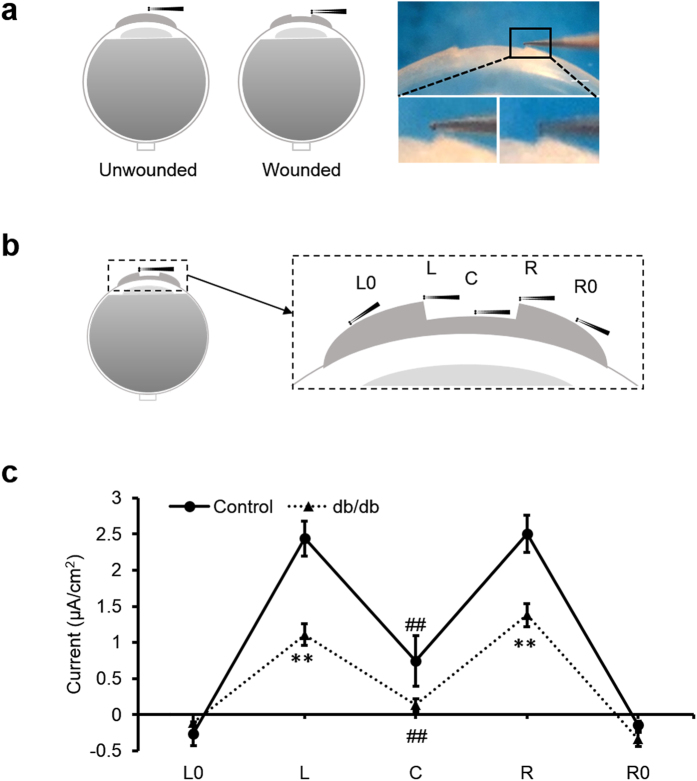
Figure 1. Diabetic corneas generated significantly weaker wound electric signal.
(a) Schematic diagram of the wound current measurement with the probe positioned at the unwounded center and wound edge. Photographs on the right show the probe in measuring position at the right wound edge. The close-ups below show the probe without vibration for clarity (left) and the probe vibrating (blurred double image) on the right. Scale bar: 250 μm. (b) Positions of the vibrating probe when measuring electric current at different places across the wounded cornea: left unwounded position (L0), left wound edge (L), wound center (C), right wound edge (R) and right unwounded positon (R0). (c) Electric current profile of wounded control and db/db diabetic corneas. Positive values are outward current (flow of positive charge), negative values are inward. Currents were significantly greater at the wound edges than at the wound center (p < 0.01; Student t-test). Currents at the wound edge of diabetic cornea were significantly weaker than in the control group (**p < 0.01). Currents at the wound center were not significantly different (##NS). Interestingly, currents at the unwounded cornea outside the wound were on average slightly inward. Data are mean ± S.E.M. from 4 independent wounds.

