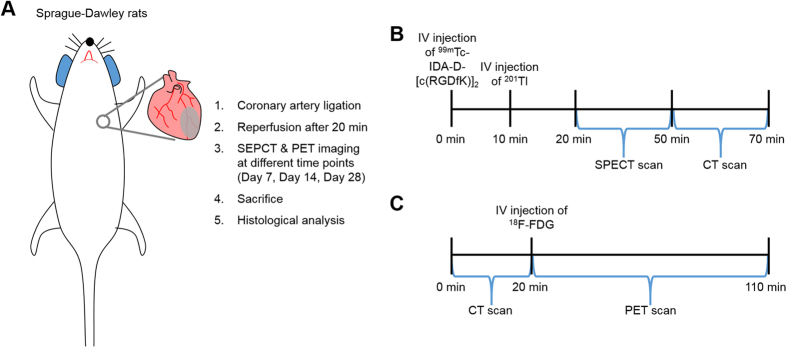
Figure 1. Schematic work flow of model generation and molecular imaging.
(A) Diagram of whole experimental procedure. The coronary artery was ligated to create myocardial infarction (MI) in Sprague-Dawley (SD) rats, followed by reperfusion after 20 minutes. Single photon emission computed tomography (SPECT) and positron emission tomography (PET) imaging were performed 7, 14, and 28 days after MI. After in vivo imaging, animals were sacrificed for histological analyses. (B) SPECT scans were obtained for 30 minutes at 10 min and 20 min post-injection of 201Tl and 99mTc-IDA-D-[c(RGDfK)]2, respectively, immediately followed by 20-min computed tomography (CT) scans. (C) 18F-FDG PET/CT was conducted with the identical animal at the same day of SPECT/CT imaging. After CT data acquisition for 20 minutes, the PET images were obtained for 90 minutes with intravenous injection of 18F-FDG.

