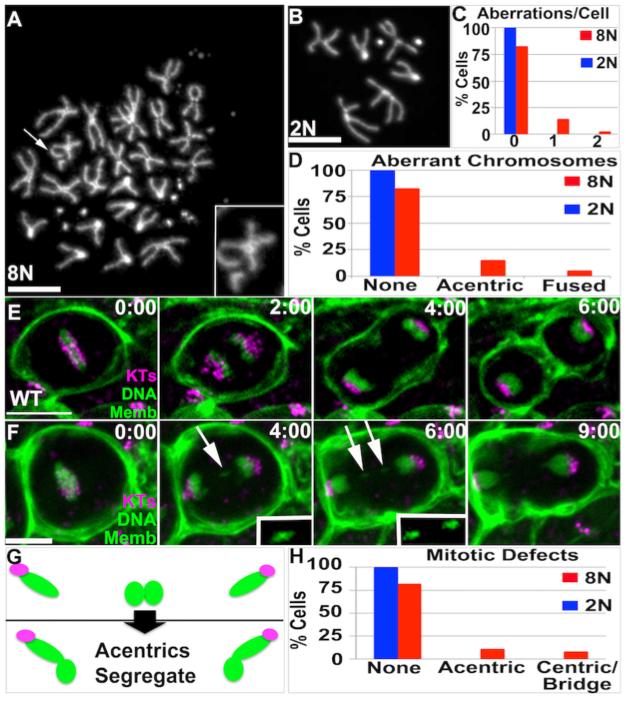
Figure2. Acentric chromosomes accumulate and segregate during Wild Type papillar development.
A.Example papillar cell with acentric chromosome (arrow, 2X magnified inset). B.Example diploid imaginal disc cell with normal karyotype. DAPI=DNA in A,B. C.Number aberrations/cell for cells examined in A,B. D.Distribution of acentric/fused chromosomes for cells examined in A,B. A-D: data from N=96 8N and N=93 2N cells respectively, from 8 replicates. The increased incidence of aberrant karyotypes in 8N vs. 2N is significant when accounting for increased chromosomes in 8N cells (Chi square, p<.05). E,F.Time-lapses of papillar mitosis. CenpC-Tomato=kinetochores (KTs, purple), histone H2AV=DNA (green, nuclear), and Moesin-GFP=cell membranes (Memb, green). Time is in minutes relative to anaphase onset. E.Example of normal mitotic segregation. F. Example of acentric chromatids that segregate into daughter nuclei. White arrow and 2X magnified, contrast-enhanced insets highlight segregating acentric DNA. G.Diagram of fate of acentric and fused papillar chromosomes. Green=DNA, Purple=Centromeres. H.Frequency of mitotic errors in 8N papillar and 2N imaginal disc tissue. Data from N=92 (papillar) and N=89 (imaginal disc) movies (numerous replicates). Scale bar=5μm.

