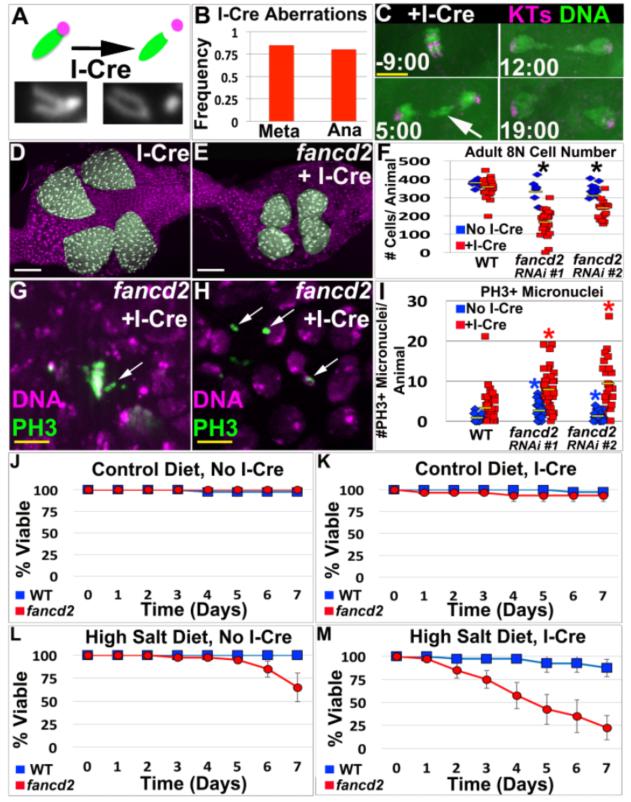
Figure5. FANCD2 promotes papillar cell viability and prevents micronucleus formation specifically in response to acentric chromosomes.
A.Top-Diagram of I-Cre system. One acrocentric X chromatid (green) shown before/after I-Cre induced DSB severs the connection with the centromere (purple). Bottom-Example of uncut and cut X-chromosomes in papillar cells from I-Cre expressing flies. B.Frequency of mitotic papillar cells after I-Cre (expressed during endocycles) with at least 1 aberrant X chromosome at metaphase (Meta, from chromosome preparation data) or with lagging DNA at anaphase (Ana, from live imaging data). From N=58-82 cells/condition, from multiple replicates. C.Representative time-lapse papillar DNA segregation following I-Cre (expressed during endocycles). CenpC-Tomato=kinetochores (KTs, purple), histone H2AV=DNA (green). Time in min. relative to anaphase onset. Arrow indicates lagging DNA, which segregates. D.WT adult rectum after I-Cre (expressed during endocycles). E.fancd2RNAi#1 adult rectum after I-Cre (expressed during endocycles). Papillae false-colored green, DNA in purple in D and E. F.Avg. adult papillar cell number/animal for WT and fancd2RNAi#1 +/− I-Cre. From N=8-23 animals/condition, multiple replicates. *=significant change between +/− I-Cre compared to WT (Methods). Yellow bars= mean. G.Unaligned PH3+ chromosomes (green labeling/white arrows, DNA in purple) in fancd2RNAi#1 after I-Cre. H.Persistent PH3+ micronuclei (green labeling/white arrows, DNA in purple) in fancd2RNAi#1 after I-Cre. I. Number PH3+ micronuclei +/− I-Cre in WT vs. fancd2RNAi#1 and fancd2RNAi#2. Yellow bars= mean. From N=17-23 animals/condition, multiple replicates. *=significant difference from WT (Two-tailed T-test, p<.005). DAPI=DNA in all images. J-M.Survival of adults of WT (blue) and fancd2 RNAi#1 (red) animals over time for the indicated I-Cre and diet conditions. Bars= standard error. Each genotype/condition represents 3 replicates with 10 animals/replicate. White scale bar=50μm, yellow scale bar=5μm.

