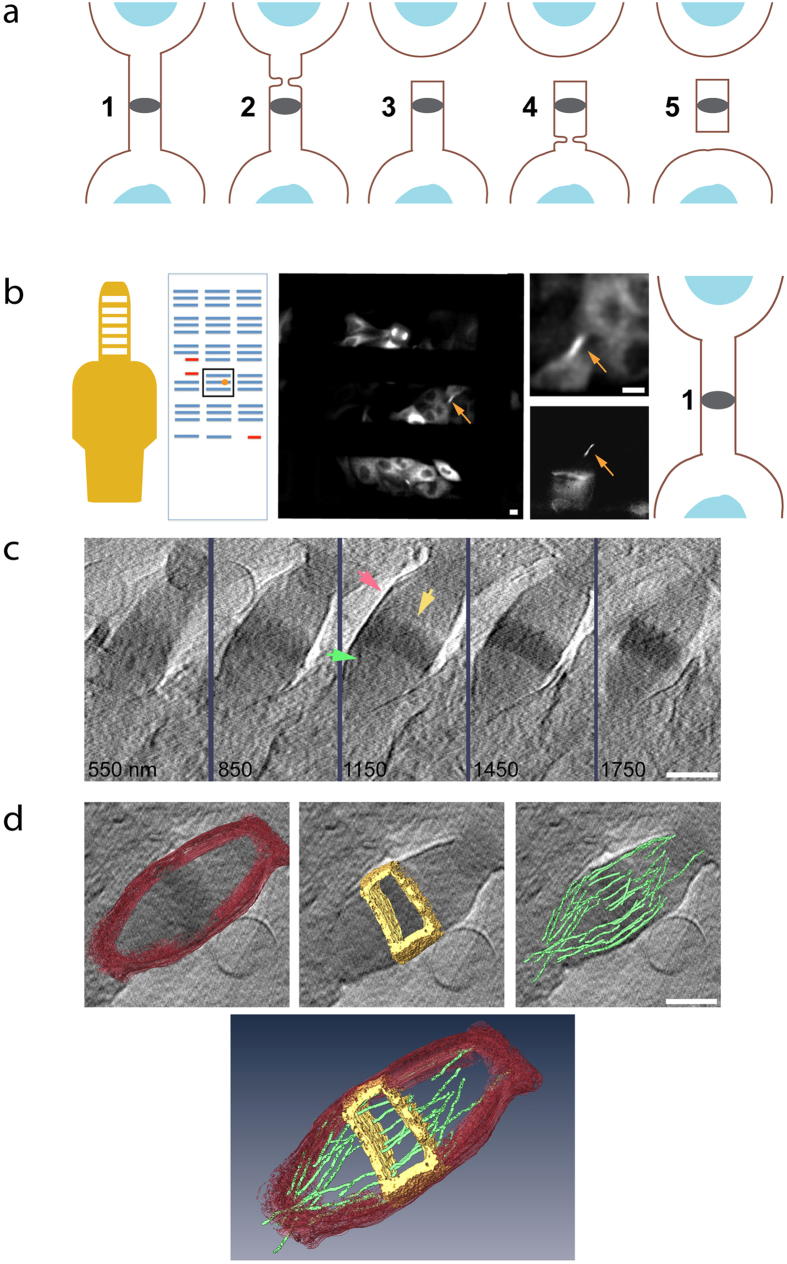
Figure 1. Imaging cytokinetic abscission with cryo-SXT.
(a) A scheme of mammalian cytokinetic abscission. Numbers indicate succeeding stages of abscission (left to right; early to late, respectively). Blue, nucleus; brown line, membrane; gray ellipse, midbody dark zone. (b) Description of workflow. MDCK cells stably expressing tubulin-GFP were plated on tomography grids. Entire grids were imaged using a spinning disk microscope (SD) and the positions of selected intercellular bridges was mapped. Using the special layout on the tomography grid, mapped intercellular bridges were located at the BESSY microscope and fluorescence images of selected locations were acquired. Fluorescence images were used to determine the stage of abscission (stages 1–5). Shown from left to right are: the tomography grid, the grid map, fluorescence SD image of the area in map highlighted in a black square, a zoomed in image of a selected bridge and an image of the same bridge obtained at BESSY, a scheme of the abscission stage as determined by the fluorescence images. (c) Cryo-SXT data acquisition. An X-ray tilt series of selected intercellular bridge was acquired and reconstructed (see methods). Shown are tomographic Z sections of the intercellular bridge in (b). Z sections cover the entire intercellular structure with 300 nm steps (red arrow, intercellular bridge membrane; yellow arrow, dark zone; green arrow, microtubules). (d) 3D rendering. Selected features of the intercellular bridge were rendered (red, intercellular bridge membrane; yellow, dark zone; green, microtubules). Shown are rendered structures overlaid on tomographic data (top) and an image integrating the rendered structures (bottom). Scale bars: (b) 10 μm; (c–d) 1 μm.

