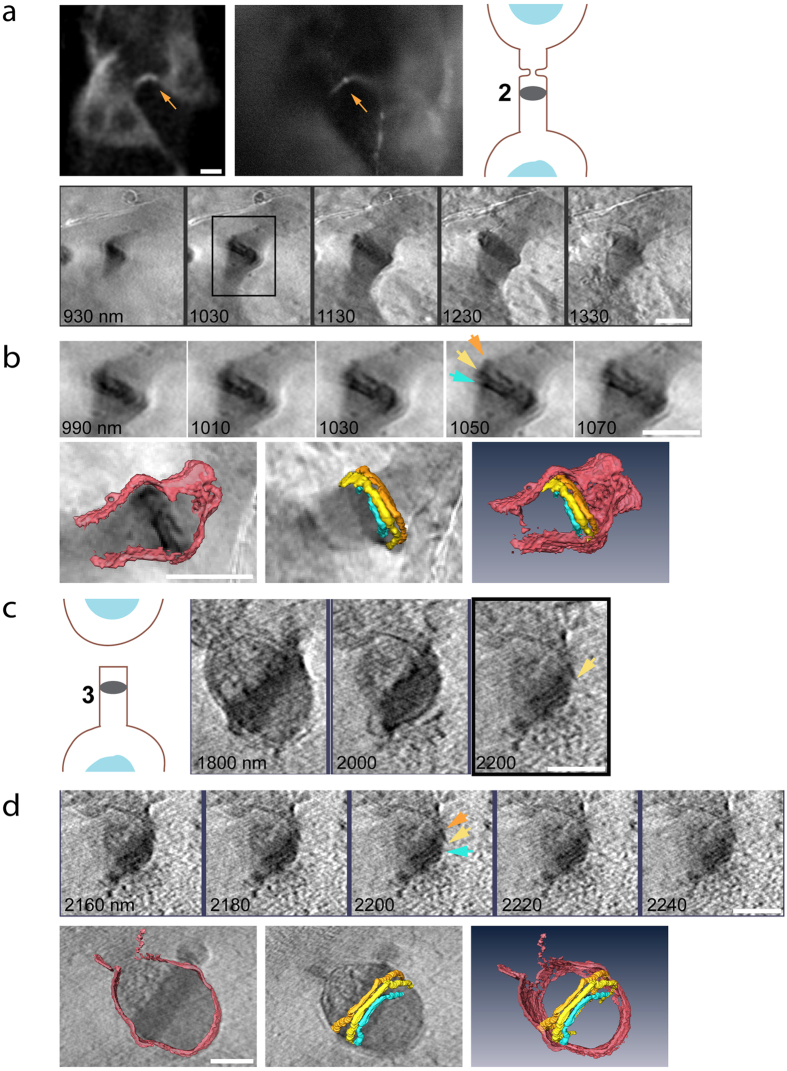
Figure 3. Resolving high-ordered structures in the dark zone.
(a) Representative intercellular bridge at abscission stage 2. Top panel (left to right): fluorescence image of the intercellular bridge acquired on an SD microscope (scale bar, 10 μm), fluorescence image acquired at BESSY II, a scheme indicating the stage in abscission. Bottom panel: reconstructed tomographic Z sections (binned X4) of the intercellular bridge (100 nm steps). (b) Top panel: subset and zoomed in images of the area highlighted in black rectangle in (a). Data set is centered on the high-ordered structures that were found within the dark zone (Z sections are at 20 nm steps). Bottom panel: 3D rendering of selected structures in top panel. Left, intercellular bridge membrane overlaid on tomographic data; middle, high-ordered structures in dark zone overlaid on tomographic data; right, an integrated image of rendered data. Arrows on tomogram correspond to the rendered high-ordered dark zone structures. (c) Subset of reconstructed tomographic Z sections of the intercellular bridge shown in Fig. 2b (200 nm steps), centered on distinct structures in the dark zone and a scheme indicating the stage in abscission (left). (d) A smaller subset of the tomogram shown in (c) (20 nm steps), centered on the three high-ordered structures residing in the dark zone. 3D rendering of selected structures in this region are shown below. Left, intercellular bridge membrane overlaid on tomographic data; middle, high-ordered structures in dark zone overlaid on tomographic data; right, an integrated image of rendered data. Arrows on tomogram correspond to the rendered high-ordered dark zone structures. n (filaments in dark zone) = 8/13; stage 1, 1/5; stage 2, 4/5; stage 3, 2/2; stage 4 1/1. Scale bars: (a–d) 1 μm.

