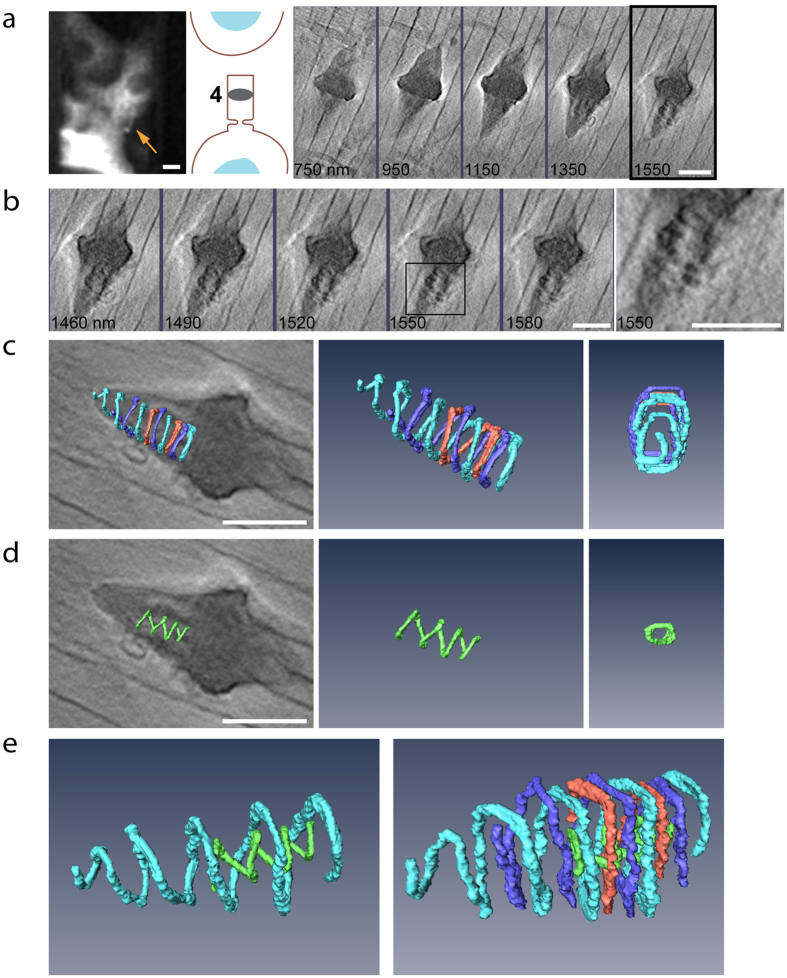
Figure 4. Helical filaments at the abscission site.
(a) Intercellular bridge at abscission stage 4 (left to right): fluorescence image of the intercellular bridge (scale bar, 10 μm), a scheme indicating the stage in abscission and reconstructed tomographic Z sections spanning the entire intercellular bridge (200 nm steps). (b) Enlarged subset of reconstructed tomographic Z sections of the intercellular bridge shown in (a). Subset (30 nm steps) is centered on the cortical structures observed at the abscission site. An enlarged view of the area highlighted in a black square is shown to the right. (c) 3D rendering of large helical filaments found in the abscission site. Left to right, helical filaments overlaid on tomographic data; rendered helical filaments, end on view of rendered helical filaments. Color represents individual filaments. (d) 3D rendering of a small diameter helical filament found in the abscission site. Left to right, inner helix overlaid on tomographic data; rendered inner helix, end on view of rendered inner helix. (e) The small helix is nested inside the three large helices and spirals in the counter orientation to that of the larger helices. Left, image of one of the rendered large diameter helical spirals (cyan) and the rendered small diameter helix (green). Right, image of all rendered helical filaments at the abscission site. Scale bars: (a–e) 1 μm.

