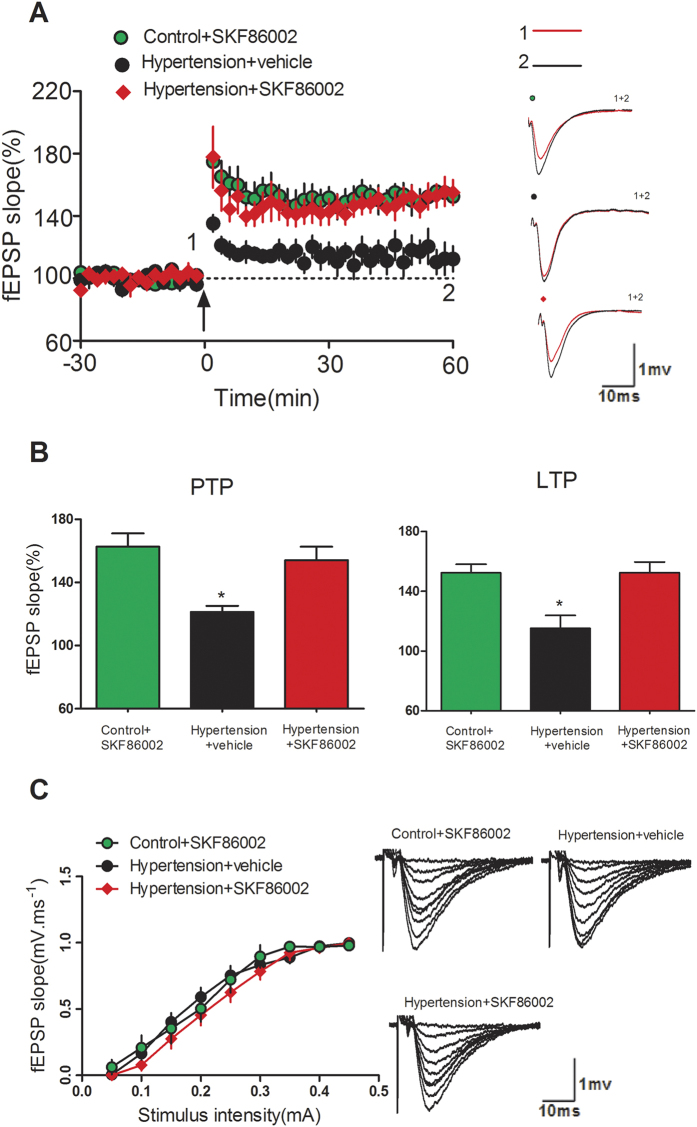
Figure 5. SKF86002 rescued hippocampal LTP deficit in hypertensive mice.
(A) LTP induced by TBS in three group mice. Insert is representative waves before and after TBS application. Right graph shows the traces in a represented fEPSPs recorded in a hippocampal slice from three group. (B) PTP and LTP data from three group were summarized and compared together, n = 8 slices from five animals for each group, *p < 0.05, hypertension + vehicle group vs control + SKF86002 group or hypertension + SKF86002 group. (C) I/O curves are shown (all P > 0.05).

