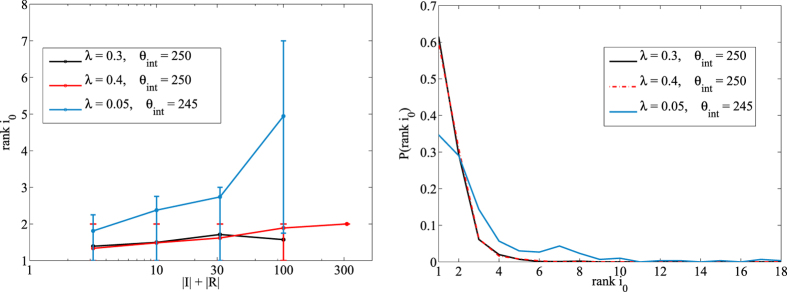
Figure 2. Left: Average abolute r0 = rank(i0) as a function of the total epidemic size NIR = |I| + |R| in the network of face-to-face contacts in a high school for different values of the threshold θint.
Each curve is an average over M = 1000 (θint = 250) or M = 300 (θint = 245) random instances. Lines are guide to the eye. Right: probability distribution of ranki0 over same epidemics for the three set of parameters.

