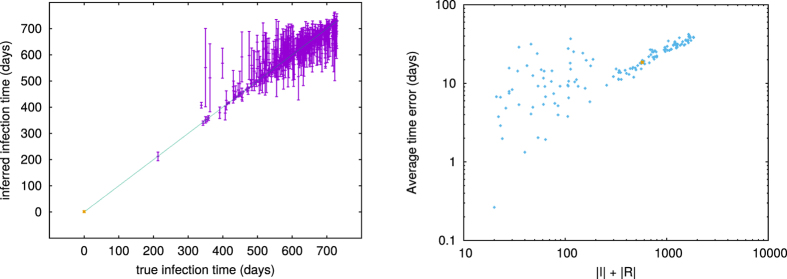
Figure 4. Left panel: inferred vs true infection time for a single epidemic cascade in the network of sexual contacts.
Epidemic parameters are λ = 0.4 and μ = 0.5/year. The vertical bars represent the standard deviation of the inferred infection time computed from the BP marginals. The zero patient, highlighted in orange, is correctly identified as the first infected individual. Right panel: Average Time Error (ATE) sorted as a function of the epidemic size NIR in 140 samples (we simulated 200 epidemic cascades and then focused on samples with NIR > 20, where enough information is present at the time of observation). Epidemic parameters are the same as in the left plot, each point represents the ATE value for a single epidemic cascade. The orange dot corresponds to the cascade on the left panel.

