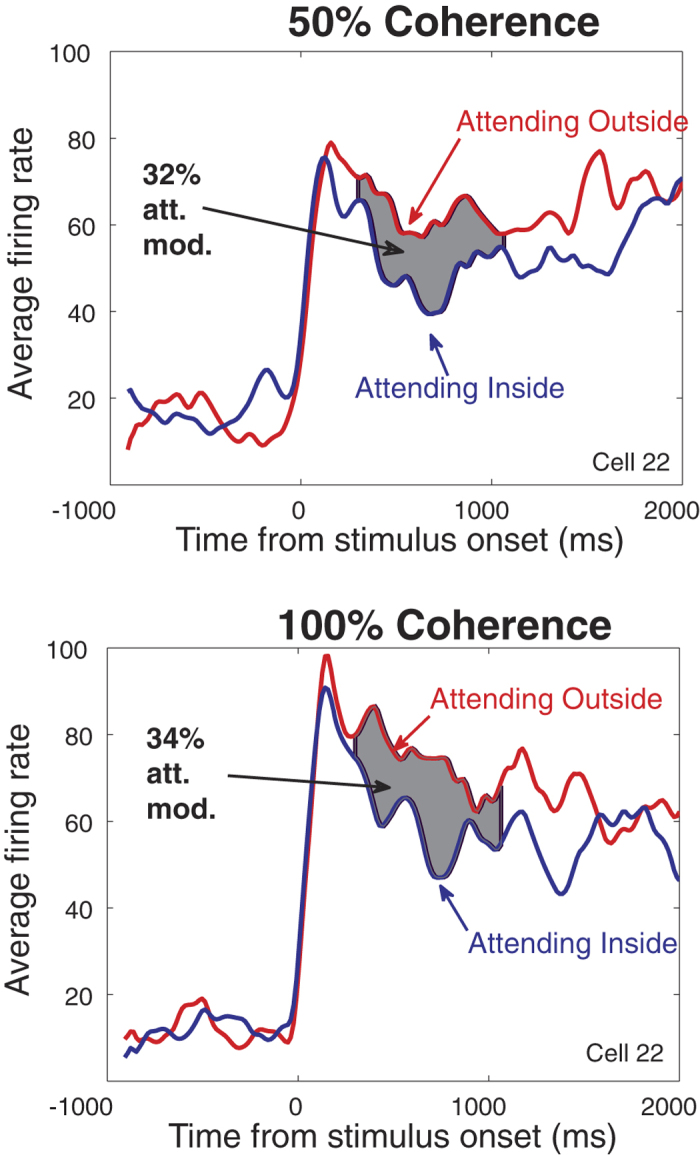
Figure 2. The time course of neuronal responses for an example cell: for two coherence levels of the preferred random dot pattern (top panel: 50%, bottom panel: 100%) in two attentional conditions (red: attending-outside; blue: attending-inside).

Gray areas indicate the attentional modulation between the two conditions (32% and 34% for 50% and 100% motion coherence respectively) within the analyzed time window.
