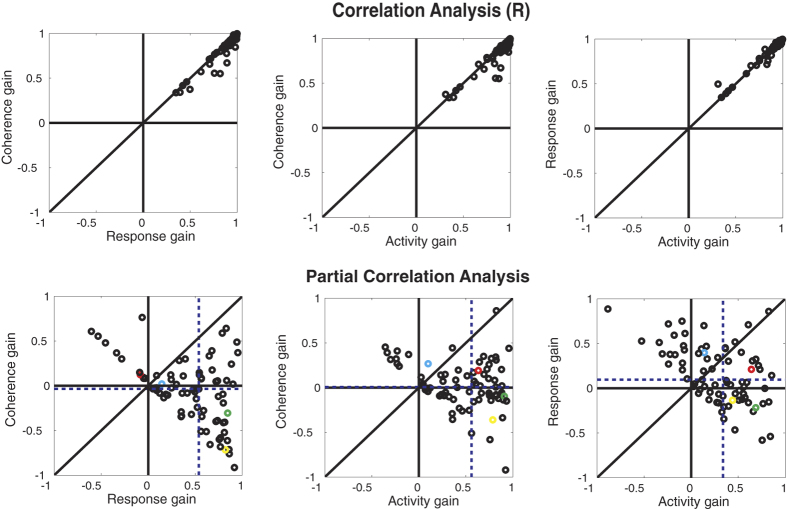
Figure 5. Correlation (top) and partial correlation (bottom) analysis for different models of attention on coherence-response functions.
The correlation analysis shows that all of the models provide a good fit to the data (Note that the values plotted are correlations (R)). The partial correlation analysis indicates that an activity gain modulation is best able to account for the effect of attention on coherence-response functions, because the median of partial correlations (vertical dashed line) is shifted towards this model in the paired comparisons. The data points from the four example cells shown in Fig. 3A have been color-coded (Cell 52: Yellow, Cell 32: Green, Cell 36: Red, Cell 31: Cyan).

