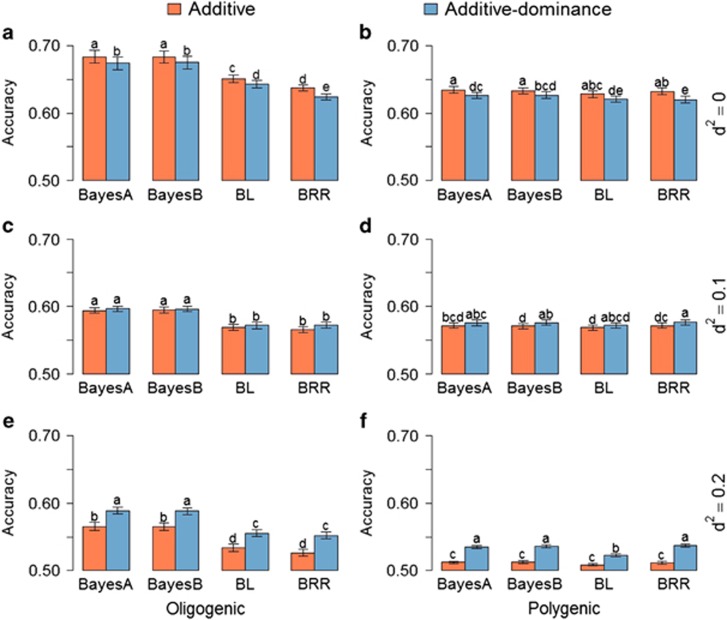
Figure 2.
Average of accuracies of whole genotypic predictions with additive and additive–dominance WGRs using different priors for six different simulated traits: (a) oligogenic and (b) polygenic traits with h2=0.25 and nondominance effects; (c) oligogenic and (d) polygenic traits with h2=0.25 and d2=0.1; and (e) oligogenic and (f) polygenic traits with h2=0.25 and d2=0.2. Error bars are s.e. among 10 replicates. Means with same letter are statistically equal by Tukey's test (P<0.05).

