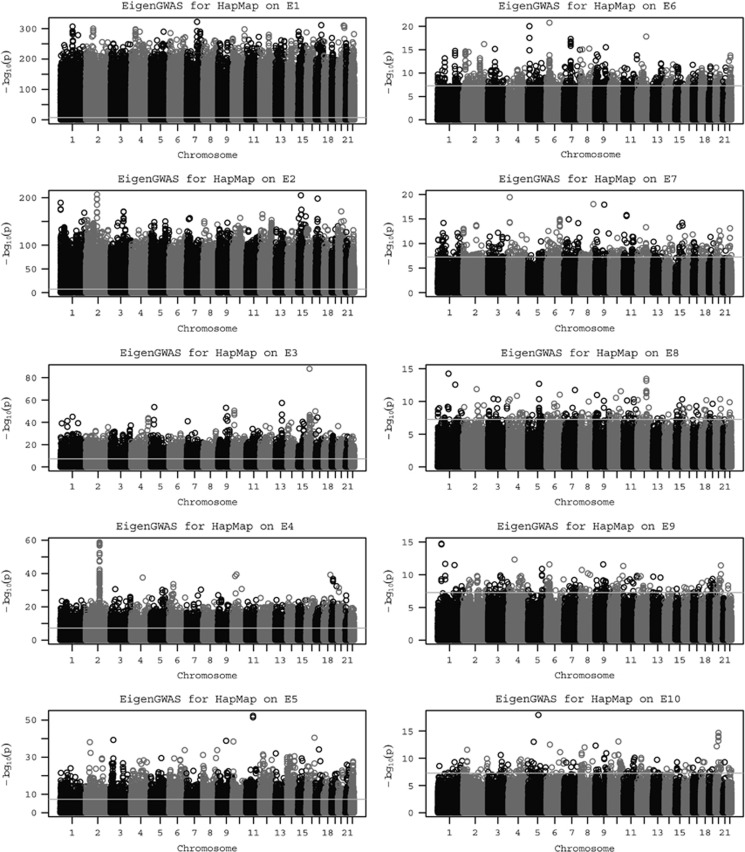
Figure 1.
Manhattan plots for EigenGWAS for top 10 eigenvectors for HapMap. Using Ei as the phenotype, the single-marker association was conducted for nearly 919 133 markers. The left panel illustrates from E1 to E5 and the right panel from E6 to E10. The horizontal lines indicate genome-wide significance after Bonferroni correction.

