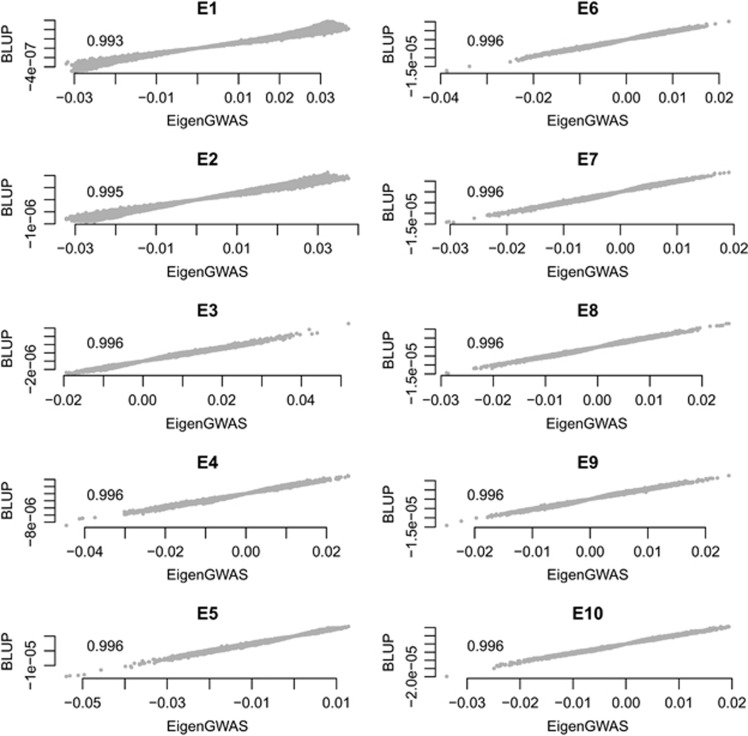
Figure 2.
Linear correlation for the SNP effects estimated using EigenGWAS and BLUP for HapMap3. The x axis represents EigenGWAS estimation for SNP effects, and the y axis represents BLUP estimation for SNP effects. The left panel illustrates from E1 to E5 and the right panel from E6 to E10. As illustrated at top left in each plot, the correlation, measured in R2, is nearly 1.

