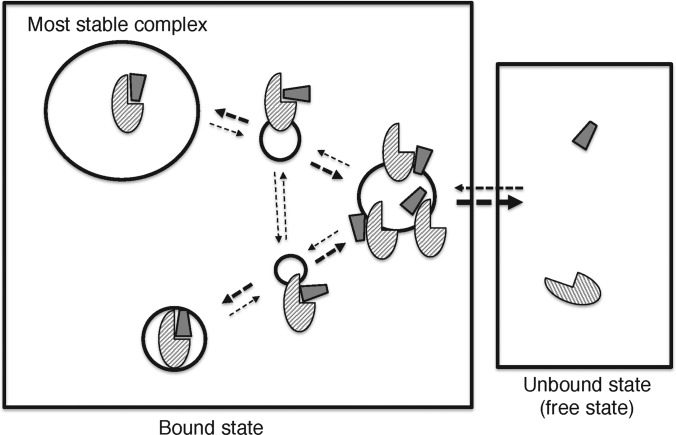
Figure 1. Schematic representation of complex formation.
Solid-line circles represent populations of conformational clusters. Broken-line arrows represent possible pathways of conformational transitions. The larger the circle, the higher the population. The bolder the arrow, the larger the rate constant for the transition.

