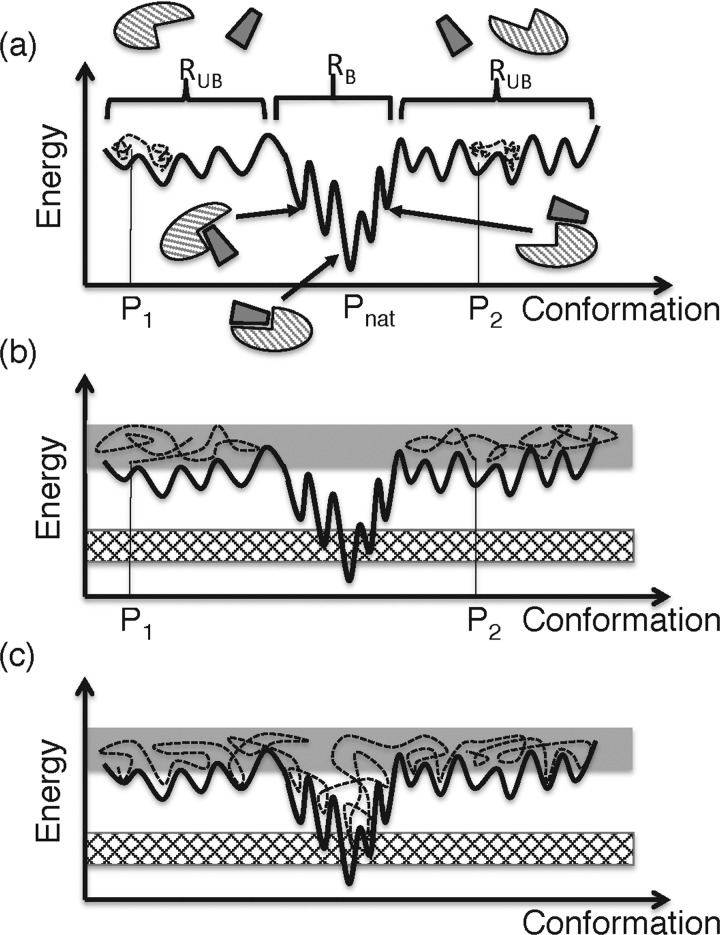
Figure 2. Schematic representation of energy surface and simulation trajectories.
The x and y axes represent conformation and energy for a two-molecular system, respectively. The black curved line represents the energy surface, where energy minima and energy barriers are distributed. Although the conformation of the system is defined originally in a high-dimensional space, the space shown in this figure is one-dimensional (i.e. x axis). Molecular structures are also shown schematically. RUB is a region where unbound or slightly touching molecules are distributed, and RB a region where various complex forms are distributed. Although RUB is divided into two in this figure, the two may be connected in the original high-dimensional space. (a) Broken lines represent simulation trajectories at room temperature starting from conformations at P1 and P2, which are far from the native complex structure (Pnat). The conformation moves slowly in the space because energy barriers interfere with the motion. (b) Simulation trajectories (broken lines) at high temperature. The trajectories fluctuate in a high-energy range (shaded energy range), which involves RUB, and the room temperature range (checkered range) is not sampled. The volume of RB is considerably narrower than that of RUB in the original high-dimensional space. (c) Trajectory from multi-canonical simulation, which samples the high- and low-energy ranges evenly.

