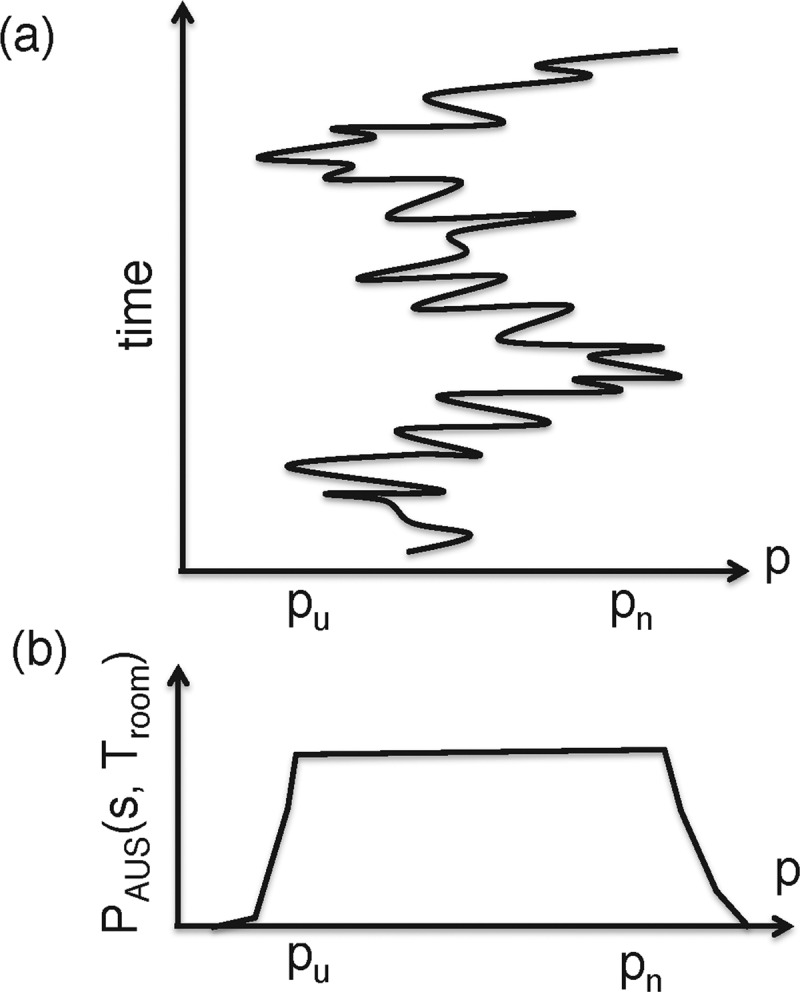
Figure 5. Scheme for AUS.

(a) The conformation fluctuates in range [pu,pn] of reaction–coordinate axis P with time. (b) Conformational distribution PAUS(p, Troom) resulted from AUS.

(a) The conformation fluctuates in range [pu,pn] of reaction–coordinate axis P with time. (b) Conformational distribution PAUS(p, Troom) resulted from AUS.