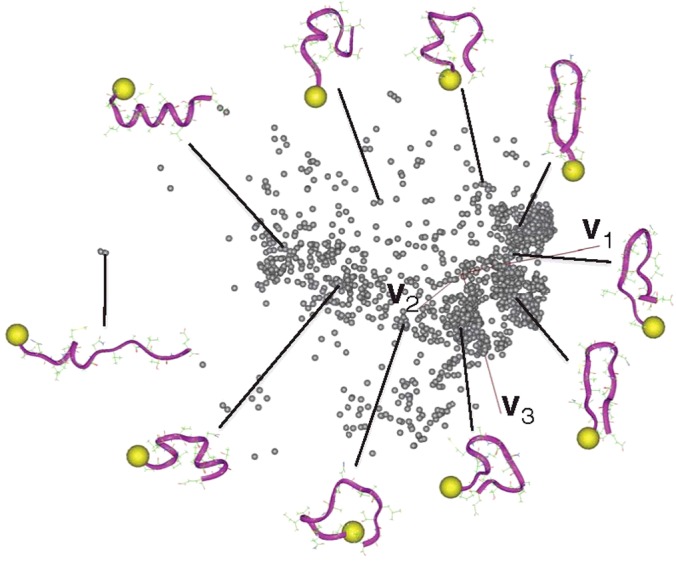
Figure 8. Conformational distribution of Q(300 K) for single NRSF fragment.

Axes v1, v2 and v3 are calculated as for Figure 7. Some conformations are also displayed. Yellow spheres indicate the N-terminus of the NRSF fragment.

Axes v1, v2 and v3 are calculated as for Figure 7. Some conformations are also displayed. Yellow spheres indicate the N-terminus of the NRSF fragment.