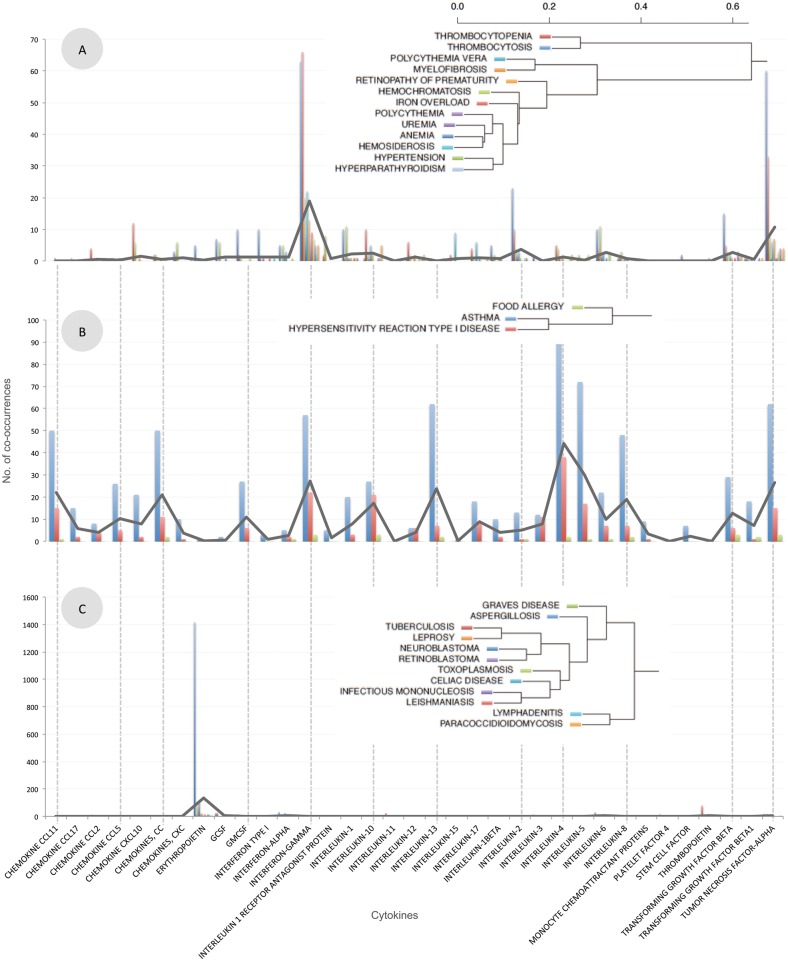
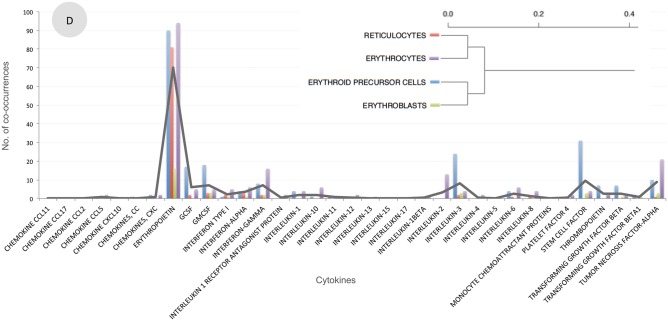
Figure 3:
Selected disease and cell type clusters. Diseases (shown in A, B, and C) or cell types (shown in D) were clustered based on their pattern of co-occurrence with cytokines. For each cluster, the hierarchical dendrogram is shown, along with a plot illustrating the number of co-occurrences for each disease/cell and each cytokine. Black lines illustrate the average of the co-occurrences in each cluster.


