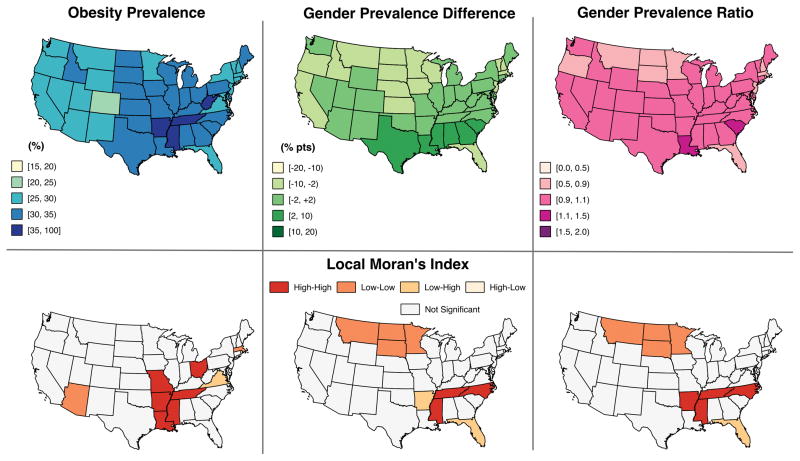
Figure 1. Age-adjusted US obesity prevalence, obesity gender difference and ratio, & corresponding local moran’s indices.
Data source: 2013 Behavioral Risk Factor Surveillance System. Data were age-standardized to US 2000 projected population. Obesity prevalence, gender prevalence difference and gender prevalence ratio show global spatial autocorrelation (z-score = 5.10, 4.89, 4.72 respectively (p-values < 0.001)). Bottom row represents Local Moran’s Indices (LMI) (p-value ≤ 0.01) with ‘high-high’ indicating states with high values near other states with high values, ‘low-low’ indicating states with low values near other states with low values, ‘low-high’ and ‘high-low’ indicating spatial outliers, with all other states having non-significant LMI. The cluster of states with higher female obesity prevalence (high-high) includes Mississippi, Tennessee, and N. Carolina. The cluster of states with higher male obesity prevalence (low-low) includes Montana, North Dakota, South Dakota, and Minnesota. Florida and Arkansas are spatial outliers.

