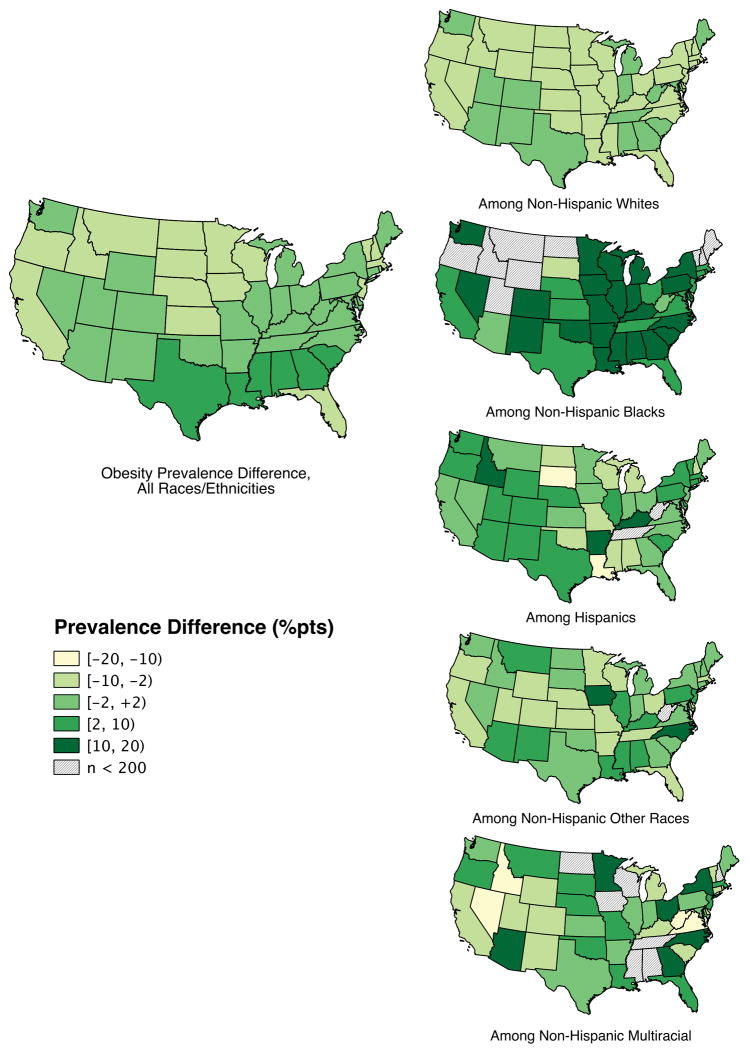
Figure 2. Age-adjusted obesity gender difference, by race/ethnicity.
Data source: 2013 Behavioral Risk Factor Surveillance System, data pooled across 2011–13 for the four non-White racial/ethnic groups. Data were age-standardized to US 2000 projected population. The darkest color represents states with higher female prevalence and the lightest represents states with higher male prevalence. States patterned with diagonal lines were excluded from spatial analysis due to small sample sizes (n <200). Gender difference among all race/ethnicities combined (z-score = 4.89, p-value < 0.001) and among non-Hispanic Whites (z-score = 3.25, p-value < 0.001) show positive global spatial autocorrelation; GMI of prevalence differences among non-NH White races/ethnicities are not significant at the 0.05 level.. Other races include: Asian, Native American, Alaskan Native and Pacific Islander.

