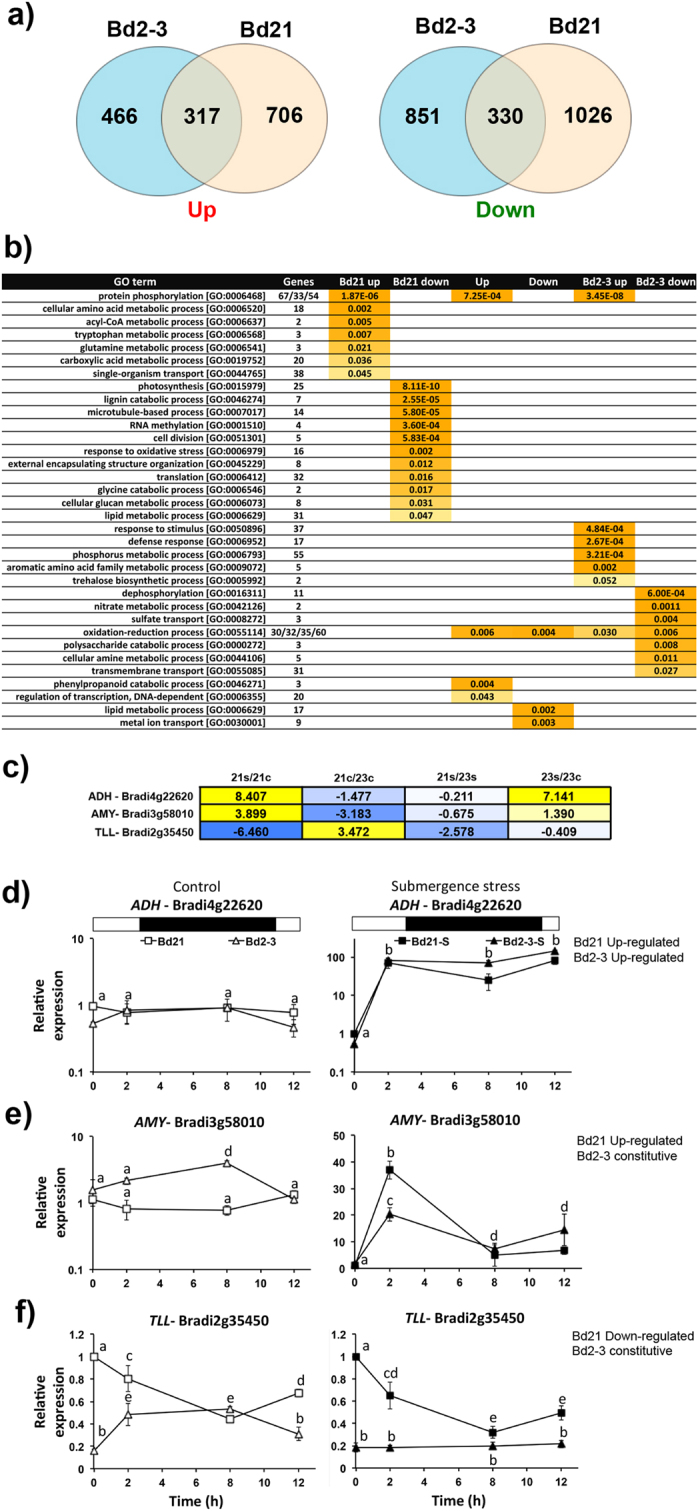
Figure 2. Transcriptome mobilization in the sensitive and tolerant ecotypes of Brachypodium distachyon.

(a) Venn diagrams showing the number of commonly and exclusively up- and down-regulated transcripts in the ecotypes after 2 d submergence stress. Data obtained by RNA-Seq from three independent experiments (for each ecotype, n = 5 plants). (b) Gene ontology categories commonly and exclusively up- or down-regulated in the Bd21 and Bd2-3 ecotypes (p ≤ 0.05). (c) Log2FC of all four possible comparison categories of the selected transcripts representing three different groups to compare Bd21 and Bd2-3: Up–Up (commonly up-regulated; ADH), Up–Cons (up-regulated in Bd21, constant in Bd2-3; AMY) and Down–Cons (down-regulated in Bd21, constant in Bd2-3; TLL). (d–f) Transcript dynamics during the first 12 h of submergence stress, of ADH (d), AMY (e) and TLL (f). qPCR was used and the constitutive gene was UBIQUITIN (Bradi1g32860). Bd21 control at time 0 was selected as the relative expression (=1). The white and black symbols indicate control and submergence stress treatments, respectively. Data are the mean ± S.E. of three independent experiments with two technical repeats; letters indicate differences between the ecotypes and submergence times indicated (two-way ANOVA, P-value < 0.05).
