
Fig. 2.
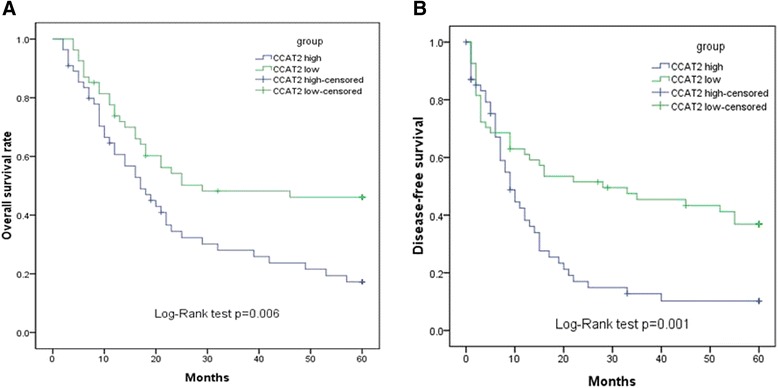
Kaplan-Meier survival curves for cervical cancer patients according to CCAT2 gene expression level. OS and DFS of patients with high vs. Low CCAT2 expression levels are shown. a OS of ovarian cancer patients with high CCAT2 expression was significantly poorer compared with rates found in patients with low CCAT2 levels (P < 0.05). b DFS of ovarian cancer patients with high CCAT2 expression was significantly poorer compared with rates in patients with low CCAT2 (P < 0.05)