Fig. 2.

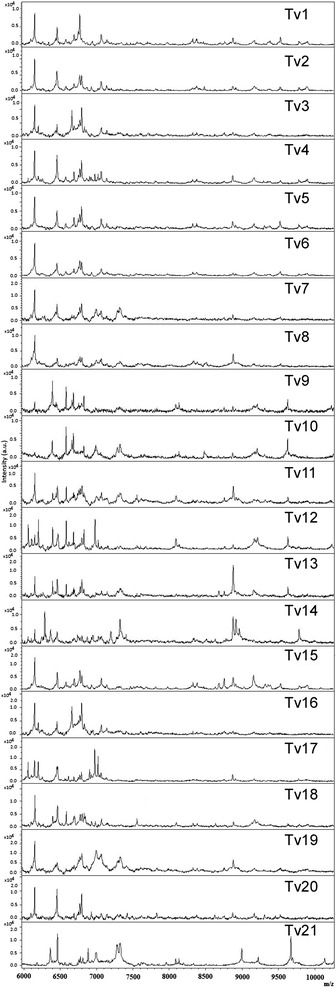
Proteic profiles of the 21 T. vaginalis isolates analysed in this study. Spectra obtained with the 21 T. vaginalis isolates by MALDI-TOF MS analysis in the molecular range 6–10 kDa

Proteic profiles of the 21 T. vaginalis isolates analysed in this study. Spectra obtained with the 21 T. vaginalis isolates by MALDI-TOF MS analysis in the molecular range 6–10 kDa