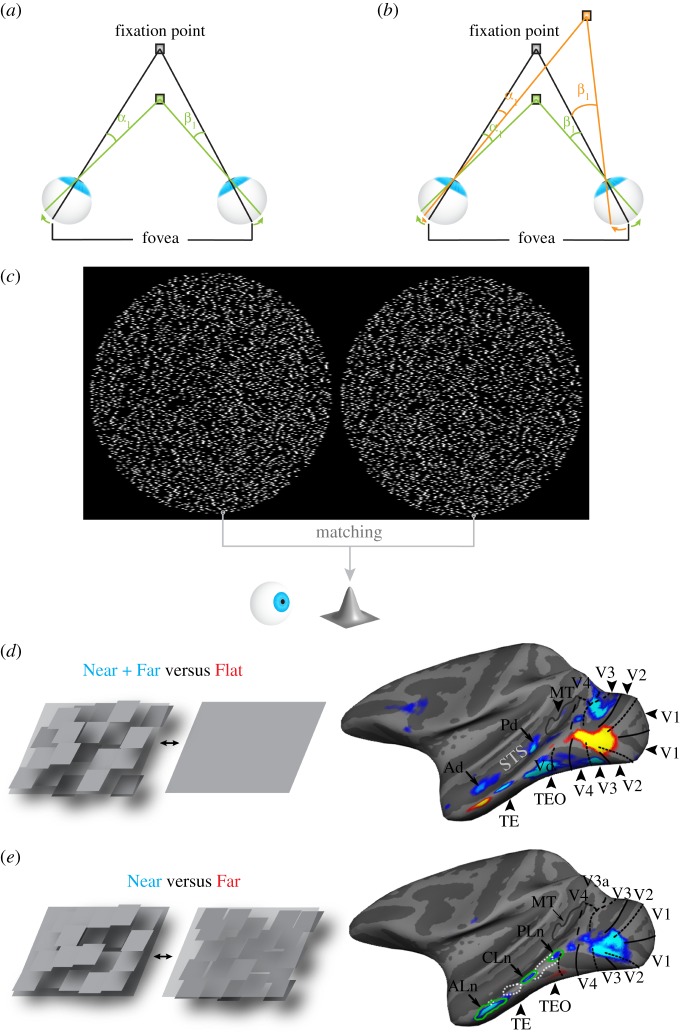
Figure 1.
Introducing absolute and relative disparity, the correspondence problem and disparity activation in the ventral visual pathway. (a) The grey fixation point projects to the fovea in each eye. A green point, placed in front of the fixation point, projects to different retinal locations with respect to each eye's fovea: to the left of the fovea in the left eye, to the right of the fovea in the right eye. The absolute disparity of the green point is defined as the angular separation of the point in one eye with respect to the fovea, minus that in the other eye, that is, α1–β1. (b) The relative disparity between the green and orange point is defined as the difference between the absolute disparity of each point: (α1–β1)–(α2–β2). (c) In order to perceive the convex cone-like 3D shape, the visual system needs to compute the disparity of all corresponding points in the two random-dot images. To do so, it must first find the corresponding points by matching each point in the left dot pattern with the equivalent point in the right pattern. (d) Stereo activation in the ventral pathway of macaques. Blue-cyan colour indicates brain regions that responded more strongly to random-dot checkerboards containing squares that were placed either in front of (Near) or behind (Far) the fixation plane, than to similar random-dot stimuli with no disparity (Flat). The pictograms on the left illustrate the stimuli by means of monocular depth cues, though the depth patterns of the actual experimental stimuli were defined solely by binocular disparities. Regions Ad, Pd and Vd represent near/far disparity-biased regions in IT that were reproduced across experiments and monkeys. (e) Blue-cyan colour indicates brain regions that responded more strongly to random-dot checkerboards containing squares that were all placed in front of (Near) the fixation plane, than to random-dot checkerboards with all squares placed behind the fixation plane (Far). Near-biased activity stretches from early visual areas (V1, V2), to more anterior ventral-pathway areas (TE). Regions PLn, CLn and ALn represent near-disparity-biased regions in IT that were reproduced across runs and monkeys. STS, super temporal sulcus; MT, middle temporal area. (d and e adapted with permission from Verhoef et al. [5].)

