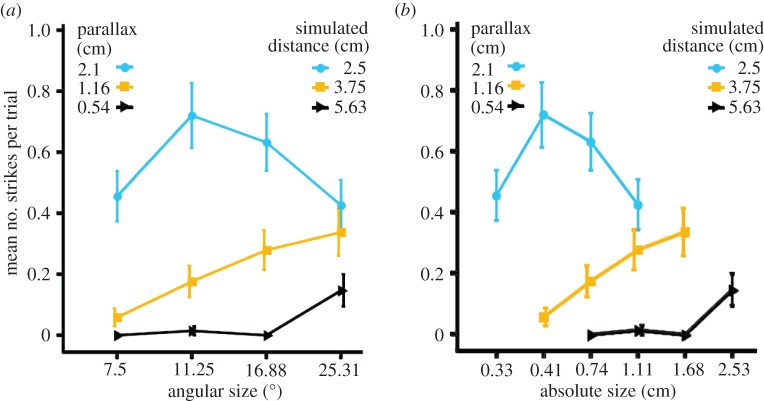
Figure 3.
Behavioural response of mantises in the crossed disparity condition. Mean number of strikes in response to different parallaxes (and the corresponding simulated distances) plotted as a function of (a) the angular size of the simulated target and (b) the absolute size of the simulated object. Error bars indicate standard error. Overlapping bars have been staggered so they can be viewed clearly. (Online version in colour.)

