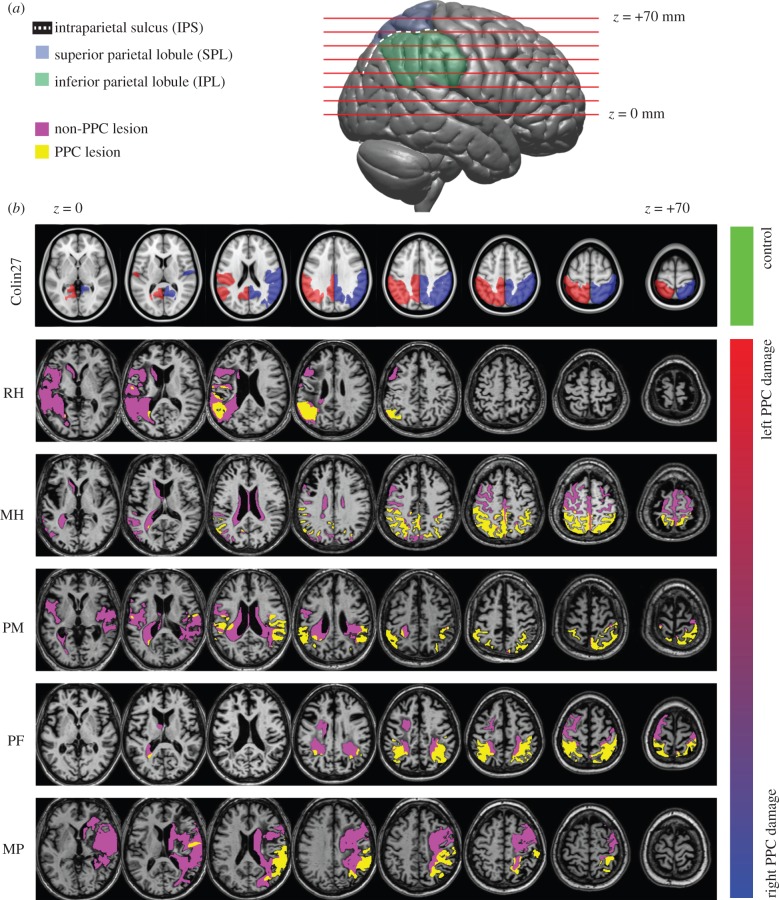
Figure 1.
(a) Lateral view of the right hemisphere indicating the slice positions shown below and the divisions of the PPC. (b) Axial slices of patients' structural MRIs, which were spatially normalized to MNI152 space. For comparison, the top row shows the T1 of a healthy individual (Colin27) also normalized to MNI152 space [45], with left (red) and right (blue) PPC regions of interest (ROIs) overlaid. Patients' lesion masks are overlaid in purple, with lesion voxels within the PPC ROI labelled yellow. In all figures, patients' data are presented in order of PPC lesion lateralization, from left to right (table 2).

