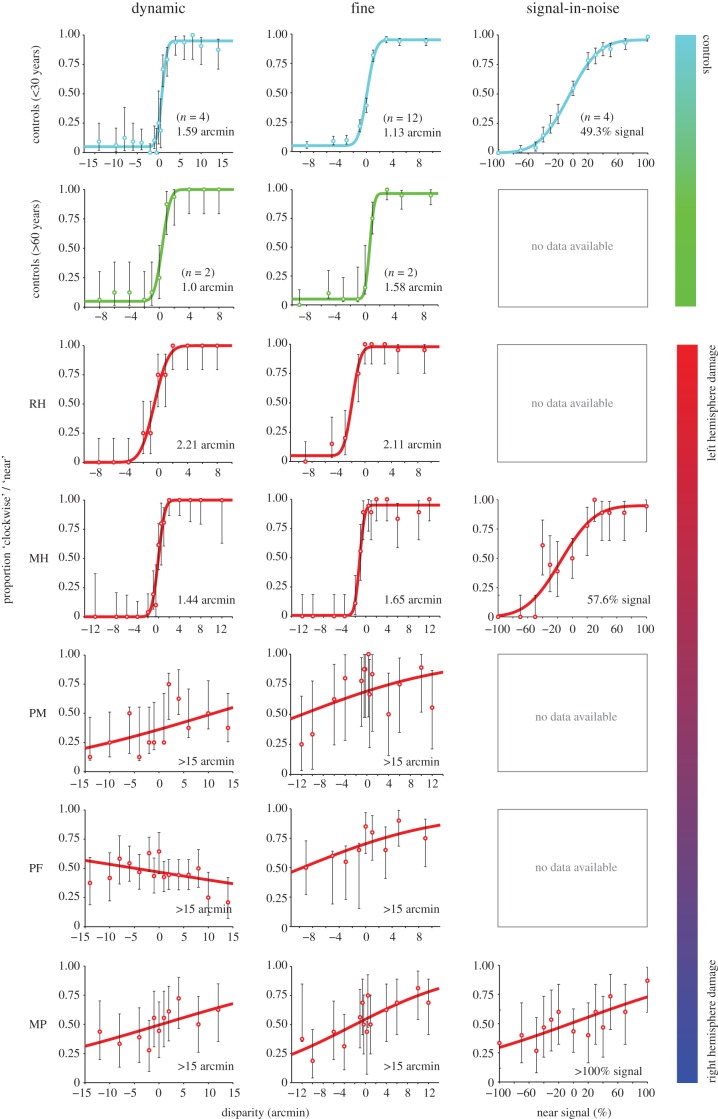
Figure 3.
Psychometric functions for all observers on the dynamic, fine, and signal-in-noise binocular disparity tasks. For dynamic disparity (left column), the proportion of ‘clockwise’ responses is plotted as a function of the relative disparity between the front surface of a clockwise rotating sphere and its axis of rotation. For fine disparity (middle column), the proportion of ‘near’ responses are plotted as a function of the disparity of the target plane relative to the border. For signal-in-noise (right column), the proportion of ‘near’ responses is plotted as a function of % signal intensity. Error bars indicate 95% CIs for binomial test. Inset values indicate thresholds at which observers responded correctly to 84% of trials. Data from the young adult (18–30 years) and older adult (60+ years) control groups are indicated in cyan and green, respectively.

